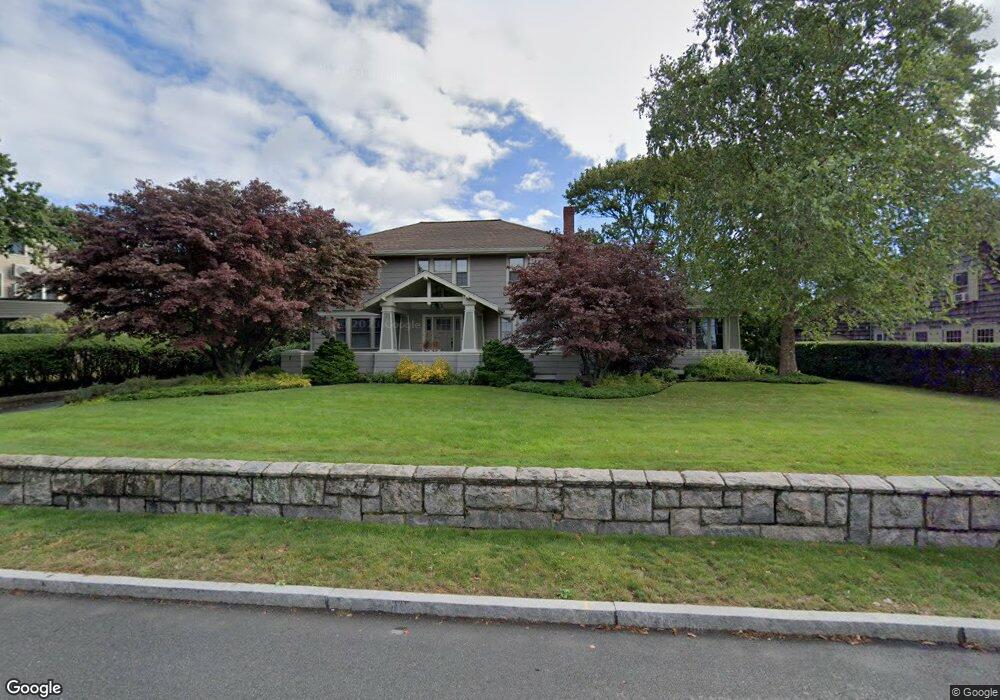
7 Fort St Fairhaven, MA 02719
Estimated Value: $955,000 - $1,129,545
4
Beds
3
Baths
2,666
Sq Ft
$388/Sq Ft
Est. Value
About This Home
This home is located at 7 Fort St, Fairhaven, MA 02719 and is currently estimated at $1,034,386, approximately $387 per square foot. 7 Fort St is a home located in Bristol County with nearby schools including Fairhaven High School, City On A Hill Charter Public School New Bedford, and St. Joseph School.
Ownership History
Date
Name
Owned For
Owner Type
Purchase Details
Closed on
Sep 11, 2023
Sold by
Crotty Thomas P and Zingara-Crotty Michele M
Bought by
Michele Z Crotty Ret and Zingara-Crotty
Current Estimated Value
Purchase Details
Closed on
Dec 14, 1990
Sold by
Old Stone Bk
Bought by
Crotty Thomas P
Purchase Details
Closed on
Apr 13, 1990
Sold by
George Feener By Mtgee
Bought by
Old Stone Bank Fsb
Create a Home Valuation Report for This Property
The Home Valuation Report is an in-depth analysis detailing your home's value as well as a comparison with similar homes in the area
Home Values in the Area
Average Home Value in this Area
Purchase History
| Date | Buyer | Sale Price | Title Company |
|---|---|---|---|
| Michele Z Crotty Ret | -- | None Available | |
| Crotty Thomas P | $200,000 | -- | |
| Crotty Thomas P | $200,000 | -- | |
| Old Stone Bank Fsb | $200,000 | -- | |
| Old Stone Bank Fsb | $200,000 | -- |
Source: Public Records
Mortgage History
| Date | Status | Borrower | Loan Amount |
|---|---|---|---|
| Previous Owner | Old Stone Bank Fsb | $260,000 | |
| Previous Owner | Old Stone Bank Fsb | $223,000 | |
| Previous Owner | Old Stone Bank Fsb | $22,500 |
Source: Public Records
Tax History Compared to Growth
Tax History
| Year | Tax Paid | Tax Assessment Tax Assessment Total Assessment is a certain percentage of the fair market value that is determined by local assessors to be the total taxable value of land and additions on the property. | Land | Improvement |
|---|---|---|---|---|
| 2025 | $92 | $982,000 | $462,400 | $519,600 |
| 2024 | $8,837 | $957,400 | $440,200 | $517,200 |
| 2023 | $8,458 | $850,100 | $377,700 | $472,400 |
| 2022 | $8,384 | $820,400 | $377,700 | $442,700 |
| 2021 | $5,459 | $748,300 | $362,400 | $385,900 |
| 2020 | $8,276 | $748,300 | $362,400 | $385,900 |
| 2019 | $7,814 | $669,600 | $300,000 | $369,600 |
| 2018 | $4,592 | $647,700 | $300,000 | $347,700 |
| 2017 | $7,574 | $629,100 | $300,000 | $329,100 |
| 2016 | $7,186 | $590,000 | $300,000 | $290,000 |
| 2015 | $6,697 | $551,200 | $272,300 | $278,900 |
Source: Public Records
Map
Nearby Homes