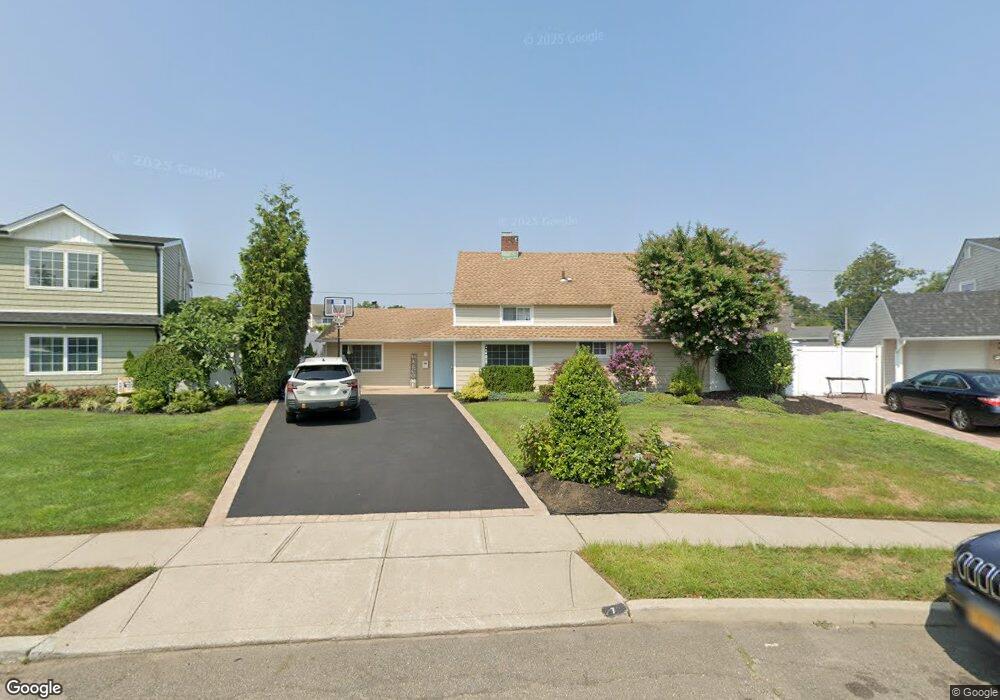
7 Foster Ln Westbury, NY 11590
Estimated Value: $726,000 - $802,965
4
Beds
2
Baths
1,508
Sq Ft
$507/Sq Ft
Est. Value
About This Home
This home is located at 7 Foster Ln, Westbury, NY 11590 and is currently estimated at $764,483, approximately $506 per square foot. 7 Foster Ln is a home located in Nassau County with nearby schools including Bowling Green Elementary School, Clarke Middle School, and Carousel Day School.
Ownership History
Date
Name
Owned For
Owner Type
Purchase Details
Closed on
Oct 20, 2010
Sold by
Davis Timothy P
Bought by
Esquierdo Christopher
Current Estimated Value
Home Financials for this Owner
Home Financials are based on the most recent Mortgage that was taken out on this home.
Original Mortgage
$350,874
Interest Rate
4.75%
Mortgage Type
FHA
Purchase Details
Closed on
Feb 12, 2004
Sold by
Mcnamara Patrick
Bought by
Davis Timothy
Purchase Details
Closed on
Sep 22, 2000
Sold by
Executor Ringenbach Amy Of The
Bought by
Mcnamara Patrick
Create a Home Valuation Report for This Property
The Home Valuation Report is an in-depth analysis detailing your home's value as well as a comparison with similar homes in the area
Home Values in the Area
Average Home Value in this Area
Purchase History
| Date | Buyer | Sale Price | Title Company |
|---|---|---|---|
| Esquierdo Christopher | $360,000 | -- | |
| Davis Timothy | $390,000 | -- | |
| Mcnamara Patrick | $195,000 | Steven Martin |
Source: Public Records
Mortgage History
| Date | Status | Borrower | Loan Amount |
|---|---|---|---|
| Previous Owner | Esquierdo Christopher | $350,874 |
Source: Public Records
Tax History Compared to Growth
Tax History
| Year | Tax Paid | Tax Assessment Tax Assessment Total Assessment is a certain percentage of the fair market value that is determined by local assessors to be the total taxable value of land and additions on the property. | Land | Improvement |
|---|---|---|---|---|
| 2025 | $10,859 | $462 | $251 | $211 |
| 2024 | $3,840 | $476 | $259 | $217 |
| 2023 | $9,027 | $473 | $257 | $216 |
| 2022 | $9,027 | $504 | $274 | $230 |
| 2021 | $12,306 | $510 | $277 | $233 |
| 2020 | $9,014 | $505 | $504 | $1 |
| 2019 | $7,545 | $541 | $540 | $1 |
| 2018 | $7,755 | $577 | $0 | $0 |
| 2017 | $4,821 | $613 | $588 | $25 |
| 2016 | $8,025 | $649 | $562 | $87 |
| 2015 | $3,275 | $685 | $476 | $209 |
| 2014 | $3,275 | $685 | $476 | $209 |
| 2013 | $3,163 | $720 | $501 | $219 |
Source: Public Records
Map
Nearby Homes