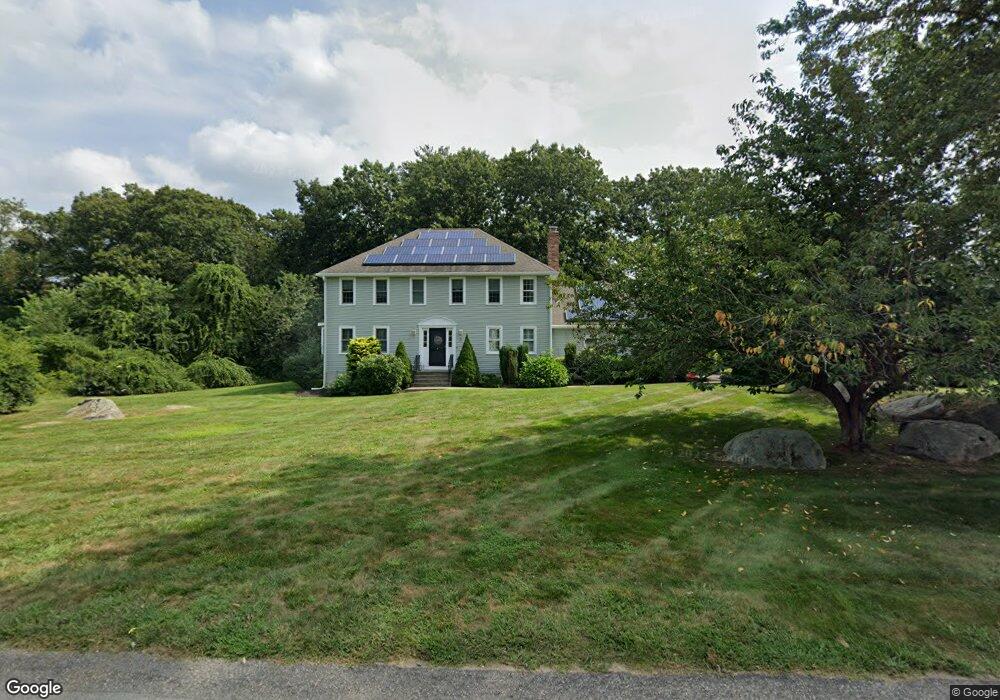
7 Fox Run Rd Medway, MA 02053
Estimated Value: $746,724 - $934,000
4
Beds
4
Baths
2,270
Sq Ft
$357/Sq Ft
Est. Value
About This Home
This home is located at 7 Fox Run Rd, Medway, MA 02053 and is currently estimated at $810,431, approximately $357 per square foot. 7 Fox Run Rd is a home located in Norfolk County with nearby schools including John D. McGovern Elementary School, Burke-Memorial Elementary, and Medway Middle School.
Ownership History
Date
Name
Owned For
Owner Type
Purchase Details
Closed on
Aug 11, 2004
Sold by
Harwood David W and Harwood Nichole M
Bought by
Parinello Amy
Current Estimated Value
Home Financials for this Owner
Home Financials are based on the most recent Mortgage that was taken out on this home.
Original Mortgage
$421,000
Interest Rate
6.16%
Mortgage Type
Purchase Money Mortgage
Purchase Details
Closed on
Jun 20, 2000
Sold by
Barden James T and Barden Nancy J
Bought by
Harwood Nichole M and Harwood David W
Create a Home Valuation Report for This Property
The Home Valuation Report is an in-depth analysis detailing your home's value as well as a comparison with similar homes in the area
Home Values in the Area
Average Home Value in this Area
Purchase History
| Date | Buyer | Sale Price | Title Company |
|---|---|---|---|
| Parinello Amy | $527,500 | -- | |
| Harwood Nichole M | $351,500 | -- |
Source: Public Records
Mortgage History
| Date | Status | Borrower | Loan Amount |
|---|---|---|---|
| Open | Harwood Nichole M | $413,250 | |
| Closed | Parinello Amy | $421,000 | |
| Closed | Parinello Amy | $53,750 | |
| Previous Owner | Harwood Nichole M | $265,000 |
Source: Public Records
Tax History
| Year | Tax Paid | Tax Assessment Tax Assessment Total Assessment is a certain percentage of the fair market value that is determined by local assessors to be the total taxable value of land and additions on the property. | Land | Improvement |
|---|---|---|---|---|
| 2025 | $9,632 | $675,900 | $324,200 | $351,700 |
| 2024 | $9,733 | $675,900 | $324,200 | $351,700 |
| 2023 | $9,629 | $604,100 | $295,100 | $309,000 |
| 2022 | $8,821 | $521,000 | $218,200 | $302,800 |
| 2021 | $8,810 | $504,600 | $203,700 | $300,900 |
| 2020 | $8,785 | $502,000 | $203,700 | $298,300 |
| 2019 | $8,193 | $482,800 | $195,400 | $287,400 |
| 2018 | $8,258 | $467,600 | $187,100 | $280,500 |
| 2017 | $8,179 | $456,400 | $182,900 | $273,500 |
| 2016 | $7,818 | $431,700 | $168,400 | $263,300 |
| 2015 | $7,861 | $431,000 | $166,300 | $264,700 |
| 2014 | $7,615 | $404,200 | $166,300 | $237,900 |
Source: Public Records
Map
Nearby Homes
- 15 Fox Run Rd
- 22 Granite St
- 8 Liberty Rd
- 28 Fisher St
- 56 Fisher St
- 42 Fisher St
- 21 Carp Rd
- 23 Cedar Farms Rd
- 462 Hartford Ave
- 429 South St
- 2 Kingson Ln Unit 2
- 394 Village St
- 6 Freedom Trail
- 44 Black Bear Cir Unit 44
- 46 Black Bear Cir Unit 46
- 15 Black Bear Cir Unit 15
- 48 Black Bear Cir Unit 48
- 13 Black Bear Cir Unit 13
- 43 Black Bear Cir Unit 43
- 11 Black Bear Unit 11
Your Personal Tour Guide
Ask me questions while you tour the home.