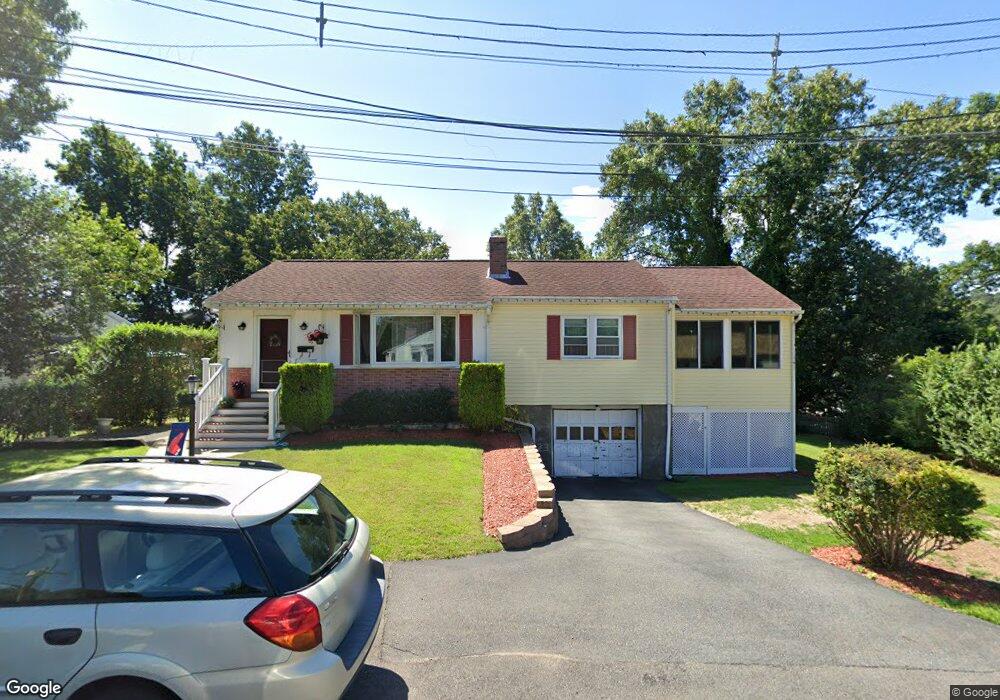
7 Frank St Woburn, MA 01801
Downtown Woburn NeighborhoodEstimated Value: $621,000 - $745,154
2
Beds
2
Baths
1,040
Sq Ft
$662/Sq Ft
Est. Value
About This Home
This home is located at 7 Frank St, Woburn, MA 01801 and is currently estimated at $688,539, approximately $662 per square foot. 7 Frank St is a home located in Middlesex County with nearby schools including Goodyear Elementary School, John F. Kennedy Middle School, and Woburn High School.
Ownership History
Date
Name
Owned For
Owner Type
Purchase Details
Closed on
Aug 10, 2012
Sold by
Capua Stephen J and Capua Maria J
Bought by
Capua Ft and Mcevoy
Current Estimated Value
Purchase Details
Closed on
Apr 5, 2007
Sold by
Kaur Rajwinder
Bought by
Heer Gurmit K and Heer Joginder S
Purchase Details
Closed on
Nov 17, 1998
Sold by
Perkins Marion W Est and Tarby
Bought by
Capua Stephen J and Capua Maria J
Create a Home Valuation Report for This Property
The Home Valuation Report is an in-depth analysis detailing your home's value as well as a comparison with similar homes in the area
Home Values in the Area
Average Home Value in this Area
Purchase History
| Date | Buyer | Sale Price | Title Company |
|---|---|---|---|
| Capua Ft | -- | -- | |
| Capua Ft | -- | -- | |
| Heer Gurmit K | -- | -- | |
| Heer Gurmit K | -- | -- | |
| Capua Stephen J | $151,000 | -- |
Source: Public Records
Mortgage History
| Date | Status | Borrower | Loan Amount |
|---|---|---|---|
| Previous Owner | Capua Stephen J | $30,000 |
Source: Public Records
Tax History Compared to Growth
Tax History
| Year | Tax Paid | Tax Assessment Tax Assessment Total Assessment is a certain percentage of the fair market value that is determined by local assessors to be the total taxable value of land and additions on the property. | Land | Improvement |
|---|---|---|---|---|
| 2025 | $4,834 | $566,000 | $309,200 | $256,800 |
| 2024 | $4,443 | $551,300 | $294,500 | $256,800 |
| 2023 | $4,486 | $515,600 | $267,700 | $247,900 |
| 2022 | $4,371 | $468,000 | $232,800 | $235,200 |
| 2021 | $4,121 | $441,700 | $221,700 | $220,000 |
| 2020 | $3,869 | $415,100 | $221,700 | $193,400 |
| 2019 | $3,694 | $388,800 | $211,200 | $177,600 |
| 2018 | $3,589 | $362,900 | $193,700 | $169,200 |
| 2017 | $3,464 | $348,500 | $184,500 | $164,000 |
| 2016 | $3,084 | $306,900 | $172,500 | $134,400 |
| 2015 | $2,962 | $291,200 | $161,200 | $130,000 |
| 2014 | $2,798 | $268,000 | $161,200 | $106,800 |
Source: Public Records
Map
Nearby Homes
- 3 Frank St
- 3 Laurel St
- 18 Carmen Terrace
- 18 Central St
- 18 Gardner Ave
- 1 Boline Place
- 13 Fremont St Unit 13
- 35 Grape St
- 69 Eastern Ave
- 62 Jefferson Ave
- 2 Eastern Ave
- 64 Garfield Ave
- 39 Garfield Ave
- 6 Stratton Dr Unit 404
- 6 Stratton Dr Unit 410
- 19 Mason Way Unit 75
- 2 Mason Way Unit 6524
- 6 Mason Way Unit 6324
- 10 Mason Way Unit 61
- 14 Grant Rd