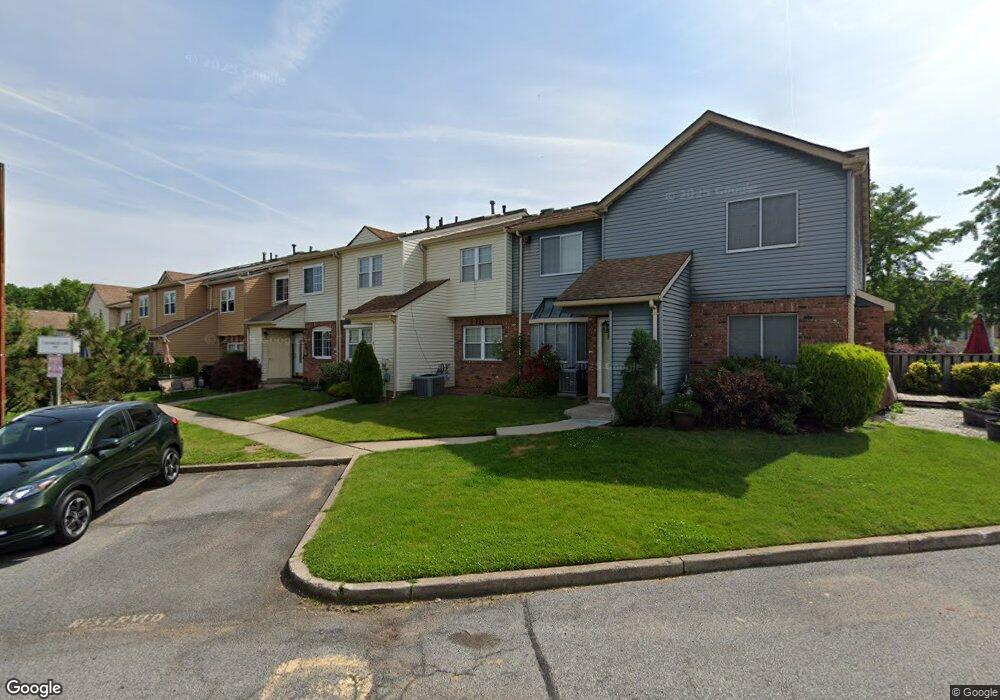
7 Franklin Ln Unit C Staten Island, NY 10306
New Springville NeighborhoodEstimated Value: $474,000 - $575,000
2
Beds
2
Baths
1,152
Sq Ft
$456/Sq Ft
Est. Value
About This Home
This home is located at 7 Franklin Ln Unit C, Staten Island, NY 10306 and is currently estimated at $524,976, approximately $455 per square foot. 7 Franklin Ln Unit C is a home located in Richmond County with nearby schools including P.S. 23 Richmondtown, Myra S. Barnes Intermediate School 24, and Susan E Wagner High School.
Ownership History
Date
Name
Owned For
Owner Type
Purchase Details
Closed on
Mar 1, 2017
Sold by
Pagan Marilyn and Santiago Marilyn C
Bought by
Santiago Marilyn C
Current Estimated Value
Home Financials for this Owner
Home Financials are based on the most recent Mortgage that was taken out on this home.
Original Mortgage
$269,000
Outstanding Balance
$223,069
Interest Rate
4.17%
Mortgage Type
New Conventional
Estimated Equity
$301,907
Purchase Details
Closed on
Mar 13, 2009
Sold by
Pirrone Rita
Bought by
Pagan Marilyn
Home Financials for this Owner
Home Financials are based on the most recent Mortgage that was taken out on this home.
Original Mortgage
$293,040
Interest Rate
4.92%
Mortgage Type
FHA
Purchase Details
Closed on
Jul 16, 2004
Sold by
Reidlinger Kurt and Reidlinger Susan
Bought by
Pirrone Rita
Home Financials for this Owner
Home Financials are based on the most recent Mortgage that was taken out on this home.
Original Mortgage
$111,000
Interest Rate
6.33%
Mortgage Type
Purchase Money Mortgage
Create a Home Valuation Report for This Property
The Home Valuation Report is an in-depth analysis detailing your home's value as well as a comparison with similar homes in the area
Home Values in the Area
Average Home Value in this Area
Purchase History
| Date | Buyer | Sale Price | Title Company |
|---|---|---|---|
| Santiago Marilyn C | -- | None Available | |
| Pagan Marilyn | $320,000 | None Available | |
| Pirrone Rita | $250,000 | First American Title Insuran |
Source: Public Records
Mortgage History
| Date | Status | Borrower | Loan Amount |
|---|---|---|---|
| Open | Santiago Marilyn C | $269,000 | |
| Closed | Pagan Marilyn | $293,040 | |
| Previous Owner | Pirrone Rita | $111,000 |
Source: Public Records
Tax History Compared to Growth
Tax History
| Year | Tax Paid | Tax Assessment Tax Assessment Total Assessment is a certain percentage of the fair market value that is determined by local assessors to be the total taxable value of land and additions on the property. | Land | Improvement |
|---|---|---|---|---|
| 2025 | $4,629 | $27,420 | $5,453 | $21,967 |
| 2024 | $2,649 | $25,320 | $5,571 | $19,749 |
| 2023 | $2,519 | $22,152 | $5,170 | $16,982 |
| 2022 | $2,193 | $23,820 | $6,120 | $17,700 |
| 2021 | $4,399 | $23,160 | $6,120 | $17,040 |
| 2020 | $4,309 | $21,540 | $6,120 | $15,420 |
| 2019 | $4,018 | $19,740 | $6,120 | $13,620 |
| 2018 | $3,763 | $18,460 | $5,940 | $12,520 |
| 2017 | $3,551 | $17,418 | $5,863 | $11,555 |
| 2016 | $3,482 | $17,418 | $5,922 | $11,496 |
| 2015 | -- | $16,965 | $5,113 | $11,852 |
| 2014 | -- | $16,006 | $4,649 | $11,357 |
Source: Public Records
Map
Nearby Homes
- 31 Franklin Ln Unit A
- 31 Franklin Ln Unit B
- 22 Tanglewood Dr
- 40 Troy St
- 38 Troy St
- 394 Clarke Ave
- 62 Daleham St
- 35 Nutwood Ct
- 420 Arthur Kill Rd
- 203 Center St
- 132 Elkhart St
- 52 Sandalwood Dr
- 52 Barlow Ave
- 168 Cotter Ave
- 87 Pemberton Ave
- 312 Barbara St
- 47 Jumel St
- 11 Ironwood St
- 98 Cotter Ave
- 92 Boyce Ave
- 7 Franklin Ln Unit E
- 7 Franklin Ln Unit D
- 7 Franklin Ln Unit B
- 7 Franklin Ln Unit A
- 7 Franklin Ln Unit F
- 7 Franklin Ln Unit 2 F
- 7 Franklin Ln Unit Building
- 7 Franklin Ln
- 7 A Franklin Ln
- 6 Revere Ln
- 6 Revere Ln Unit A
- 6 Revere Ln Unit B
- 6 Revere Ln Unit C
- 6 Revere Ln Unit D
- 6 Revere Ln Unit E
- 6 Revere Ln Unit F
- 8 Franklin Ln
- 8 Franklin Ln Unit F
- 8 Franklin Ln Unit 8B
- 8 Franklin Ln Unit C