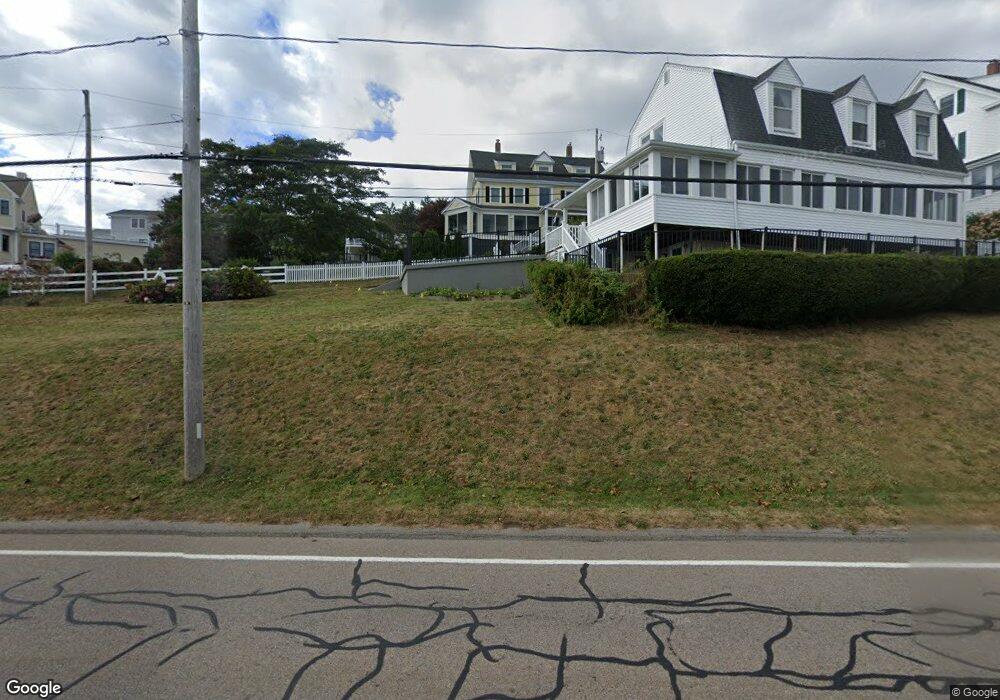
7 Gallops Hill Rd Unit 1 Hull, MA 02045
Telegraph Hill NeighborhoodEstimated Value: $1,018,000 - $1,632,000
6
Beds
3
Baths
2,586
Sq Ft
$513/Sq Ft
Est. Value
About This Home
This home is located at 7 Gallops Hill Rd Unit 1, Hull, MA 02045 and is currently estimated at $1,327,024, approximately $513 per square foot. 7 Gallops Hill Rd Unit 1 is a home located in Plymouth County with nearby schools including Lillian M. Jacobs Elementary School, Hull High School, and Memorial Middle School.
Ownership History
Date
Name
Owned For
Owner Type
Purchase Details
Closed on
Nov 26, 2008
Sold by
Jepsen Mary Lou
Bought by
Baker William F and Baker Marilyn L
Current Estimated Value
Home Financials for this Owner
Home Financials are based on the most recent Mortgage that was taken out on this home.
Original Mortgage
$417,000
Interest Rate
6.47%
Mortgage Type
Purchase Money Mortgage
Purchase Details
Closed on
Aug 2, 2006
Sold by
Kirby Debra A and Fujii Alan M
Bought by
Jepsen Marylou
Purchase Details
Closed on
May 1, 1996
Sold by
Britting Norman A
Bought by
Kirby Debra A and Fujii Alan M
Purchase Details
Closed on
Oct 30, 1989
Sold by
Lafauce John E
Bought by
Britting Norman A
Purchase Details
Closed on
Oct 27, 1989
Sold by
Lafauce John E
Bought by
Britting Norman A
Create a Home Valuation Report for This Property
The Home Valuation Report is an in-depth analysis detailing your home's value as well as a comparison with similar homes in the area
Home Values in the Area
Average Home Value in this Area
Purchase History
| Date | Buyer | Sale Price | Title Company |
|---|---|---|---|
| Baker William F | $730,000 | -- | |
| Jepsen Marylou | $800,000 | -- | |
| Jepsen Mary Lou | $800,000 | -- | |
| Kirby Debra A | $325,000 | -- | |
| Kirby Debra A | $325,000 | -- | |
| Britting Norman A | $245,000 | -- | |
| Britting Norman A | $245,000 | -- | |
| Britting Norman A | $245,000 | -- | |
| Britting Norman A | $245,000 | -- |
Source: Public Records
Mortgage History
| Date | Status | Borrower | Loan Amount |
|---|---|---|---|
| Open | Britting Norman A | $417,000 | |
| Closed | Britting Norman A | $417,000 |
Source: Public Records
Tax History Compared to Growth
Tax History
| Year | Tax Paid | Tax Assessment Tax Assessment Total Assessment is a certain percentage of the fair market value that is determined by local assessors to be the total taxable value of land and additions on the property. | Land | Improvement |
|---|---|---|---|---|
| 2025 | $14,125 | $1,261,200 | $777,700 | $483,500 |
| 2024 | $13,739 | $1,179,300 | $721,700 | $457,600 |
| 2023 | $13,747 | $1,129,600 | $696,800 | $432,800 |
| 2022 | $13,432 | $1,071,100 | $659,500 | $411,600 |
| 2021 | $13,048 | $1,029,000 | $622,100 | $406,900 |
| 2020 | $5,291 | $970,600 | $597,300 | $373,300 |
| 2019 | $11,541 | $884,400 | $522,600 | $361,800 |
| 2018 | $11,185 | $838,300 | $522,600 | $315,700 |
| 2017 | $3,512 | $815,200 | $522,600 | $292,600 |
| 2016 | $10,989 | $815,200 | $522,600 | $292,600 |
| 2015 | $10,194 | $731,300 | $423,100 | $308,200 |
| 2014 | $10,143 | $731,300 | $423,100 | $308,200 |
Source: Public Records
Map
Nearby Homes
- 7 Gallops Hill Rd
- 6 Gallops Hill Rd
- 5 Douglas Ave
- 14 Gallops Hill Rd
- 5 Douglass Ave
- 9 Gallops Hill Rd
- 5 Gallops Hill Rd
- 18 Gallops Hill Rd
- 7 Douglas Ave
- 12 Douglas Ave
- 11 Gallops Hill Rd
- 20 Gallops Hill Rd
- 20 Gallops Hill Rd Unit seasonal
- 20 Gallops Hill Rd Unit 20
- 20 Gallops Hill Rd
- 20 Gallops Hill Rd Unit 1
- 88 Spring St
- 16 Douglas Ave
- 11 Douglas Ave
- 11 Douglas Ave Unit n/a