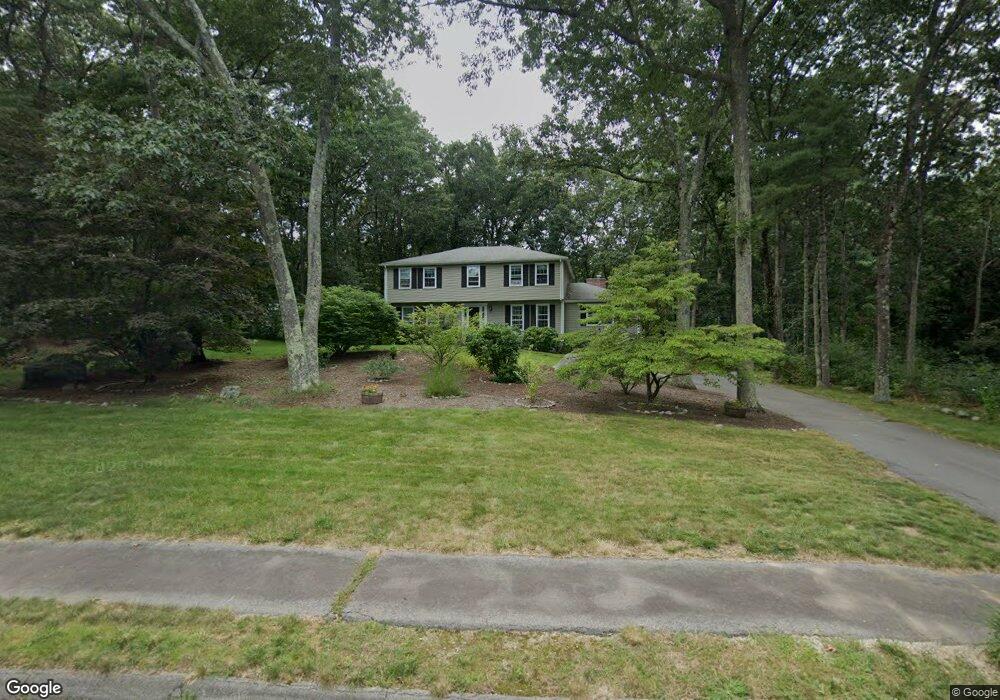
7 Garry Dr Medfield, MA 02052
Estimated Value: $1,185,595 - $1,362,000
4
Beds
3
Baths
2,580
Sq Ft
$478/Sq Ft
Est. Value
About This Home
This home is located at 7 Garry Dr, Medfield, MA 02052 and is currently estimated at $1,232,899, approximately $477 per square foot. 7 Garry Dr is a home located in Norfolk County with nearby schools including Ralph Wheelock School, Memorial School, and Dale Street School.
Ownership History
Date
Name
Owned For
Owner Type
Purchase Details
Closed on
Aug 20, 1993
Sold by
Edwards Arthur A and Edwards Mary A
Bought by
Haskell Richard D and Haskell Margaret L
Current Estimated Value
Create a Home Valuation Report for This Property
The Home Valuation Report is an in-depth analysis detailing your home's value as well as a comparison with similar homes in the area
Home Values in the Area
Average Home Value in this Area
Purchase History
| Date | Buyer | Sale Price | Title Company |
|---|---|---|---|
| Haskell Richard D | $315,000 | -- | |
| Haskell Richard D | $315,000 | -- |
Source: Public Records
Mortgage History
| Date | Status | Borrower | Loan Amount |
|---|---|---|---|
| Open | Haskell Richard D | $37,817 | |
| Open | Haskell Richard D | $472,000 | |
| Closed | Haskell Richard D | $493,600 |
Source: Public Records
Tax History
| Year | Tax Paid | Tax Assessment Tax Assessment Total Assessment is a certain percentage of the fair market value that is determined by local assessors to be the total taxable value of land and additions on the property. | Land | Improvement |
|---|---|---|---|---|
| 2025 | $14,592 | $1,057,400 | $535,300 | $522,100 |
| 2024 | $13,907 | $949,900 | $480,100 | $469,800 |
| 2023 | $13,523 | $876,400 | $460,100 | $416,300 |
| 2022 | $13,349 | $766,300 | $440,100 | $326,200 |
| 2021 | $13,244 | $745,700 | $436,100 | $309,600 |
| 2020 | $12,957 | $726,700 | $426,100 | $300,600 |
| 2019 | $12,798 | $716,200 | $414,100 | $302,100 |
| 2018 | $11,310 | $664,100 | $400,100 | $264,000 |
| 2017 | $11,960 | $708,100 | $444,100 | $264,000 |
| 2016 | $11,727 | $700,100 | $444,100 | $256,000 |
| 2015 | $10,319 | $643,300 | $391,200 | $252,100 |
| 2014 | $9,635 | $597,700 | $345,600 | $252,100 |
Source: Public Records
Map
Nearby Homes
- 115 High St
- 15 Homestead Dr
- 160 Granite St
- 30 Snyder Rd
- 71 Philip St
- 26 Dover Dr
- 26 Maple Ln Unit 26
- 19 and 23 Arlington Ln
- 42 Maple Ln
- 17 Fairview Rd
- 260 Elm St
- 91 Pleasant St Unit A6
- 82 Pleasant St
- 80 Pleasant St
- 16 Laurel Dr
- 17 Rolling Ln
- 40 Hearthstone Dr
- 25 Sandtrap Cir Unit 8
- 29 Sandtrap Cir Unit 6
- 27 Sandtrap Cir Unit 7
Your Personal Tour Guide
Ask me questions while you tour the home.