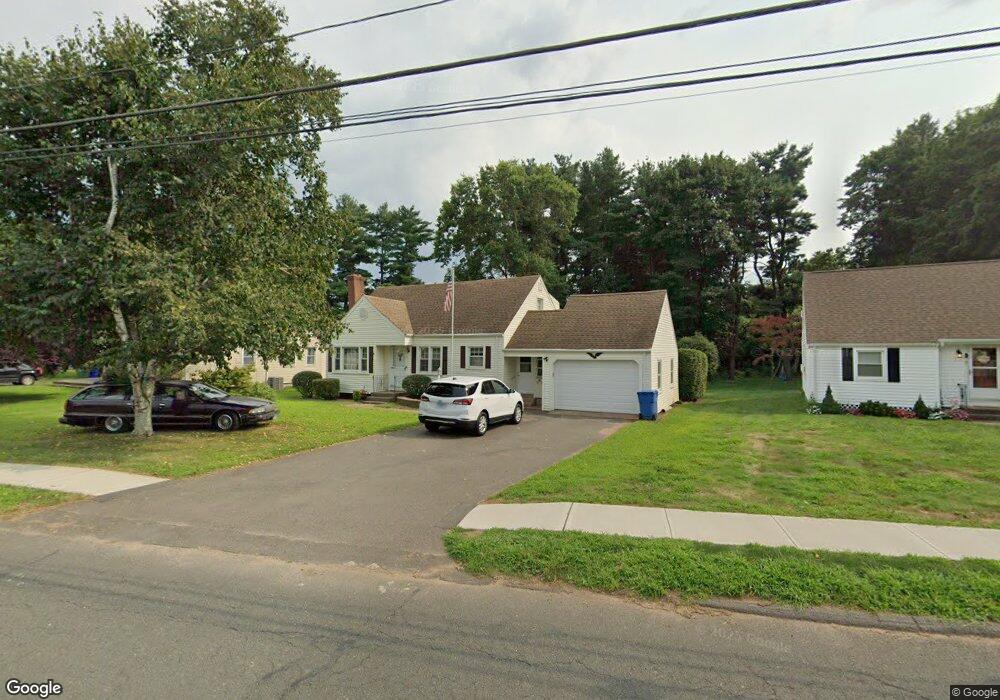
7 Geer St Cromwell, CT 06416
Estimated Value: $394,000 - $437,000
3
Beds
3
Baths
1,491
Sq Ft
$283/Sq Ft
Est. Value
About This Home
This home is located at 7 Geer St, Cromwell, CT 06416 and is currently estimated at $421,368, approximately $282 per square foot. 7 Geer St is a home located in Middlesex County with nearby schools including Edna C. Stevens School, Woodside Intermediate School, and Cromwell Middle School.
Ownership History
Date
Name
Owned For
Owner Type
Purchase Details
Closed on
Jul 25, 2023
Sold by
Zordan Kimberly F
Bought by
Frisk Karen A
Current Estimated Value
Home Financials for this Owner
Home Financials are based on the most recent Mortgage that was taken out on this home.
Original Mortgage
$180,000
Outstanding Balance
$175,245
Interest Rate
6.67%
Mortgage Type
Stand Alone Refi Refinance Of Original Loan
Estimated Equity
$246,123
Purchase Details
Closed on
May 26, 2023
Sold by
Frisk Richard H
Bought by
Frisk Karen A and Zordon Kimberly F
Home Financials for this Owner
Home Financials are based on the most recent Mortgage that was taken out on this home.
Original Mortgage
$180,000
Outstanding Balance
$175,245
Interest Rate
6.67%
Mortgage Type
Stand Alone Refi Refinance Of Original Loan
Estimated Equity
$246,123
Purchase Details
Closed on
Jun 13, 2011
Sold by
Frisk Richard H and Frisk Eleanor M
Bought by
Frisk Karen A and Zordan Kimberly F
Create a Home Valuation Report for This Property
The Home Valuation Report is an in-depth analysis detailing your home's value as well as a comparison with similar homes in the area
Home Values in the Area
Average Home Value in this Area
Purchase History
| Date | Buyer | Sale Price | Title Company |
|---|---|---|---|
| Frisk Karen A | -- | None Available | |
| Frisk Karen A | -- | None Available | |
| Frisk Karen A | -- | None Available | |
| Frisk Karen A | -- | None Available | |
| Frisk Karen A | -- | None Available | |
| Frisk Karen A | -- | None Available | |
| Frisk Karen A | -- | -- | |
| Frisk Karen A | -- | -- |
Source: Public Records
Mortgage History
| Date | Status | Borrower | Loan Amount |
|---|---|---|---|
| Open | Frisk Karen A | $180,000 | |
| Closed | Frisk Karen A | $180,000 |
Source: Public Records
Tax History Compared to Growth
Tax History
| Year | Tax Paid | Tax Assessment Tax Assessment Total Assessment is a certain percentage of the fair market value that is determined by local assessors to be the total taxable value of land and additions on the property. | Land | Improvement |
|---|---|---|---|---|
| 2025 | $5,832 | $189,420 | $71,750 | $117,670 |
| 2024 | $5,696 | $189,420 | $71,750 | $117,670 |
| 2023 | $5,571 | $189,420 | $71,750 | $117,670 |
| 2022 | $5,207 | $156,240 | $66,010 | $90,230 |
| 2021 | $5,207 | $156,240 | $66,010 | $90,230 |
| 2020 | $5,129 | $156,240 | $66,010 | $90,230 |
| 2019 | $4,955 | $150,920 | $66,010 | $84,910 |
| 2018 | $4,955 | $150,920 | $66,010 | $84,910 |
| 2017 | $4,834 | $142,460 | $61,560 | $80,900 |
| 2016 | $4,791 | $142,460 | $61,560 | $80,900 |
| 2015 | $4,470 | $142,460 | $61,560 | $80,900 |
| 2014 | $4,741 | $142,460 | $61,560 | $80,900 |
Source: Public Records
Map
Nearby Homes
- 14 Wildwood Rd
- 587 Main St
- 17 Oakwood Manor
- 6 Whitney Ct
- 12 Fairview Heights
- 120 Washington Rd
- 20 Evergreen Rd
- 21 Crest Dr
- 23 Primrose Ln
- 0 Primrose Ln
- 4 Lower Heatherwood
- 4 Lower Heatherwood Unit 4
- 35 Primrose Ln
- 5 Northbridge
- 44 Primrose Ln
- 30 Larkspur Dr
- 24 Iron Gate Ln
- 15 Oxford Ln
- 91 Highview Dr
- 58 Blackhaw Dr