7 Glen Mawr Cir Delaware, OH 43015
Estimated Value: $369,809 - $411,000
2
Beds
2
Baths
1,550
Sq Ft
$249/Sq Ft
Est. Value
About This Home
This home is located at 7 Glen Mawr Cir, Delaware, OH 43015 and is currently estimated at $386,452, approximately $249 per square foot. 7 Glen Mawr Cir is a home located in Delaware County with nearby schools including Arrowhead Elementary School, Berkshire Middle School, and Olentangy Berlin High School.
Ownership History
Date
Name
Owned For
Owner Type
Purchase Details
Closed on
Apr 24, 2015
Sold by
Boyles Brenda
Bought by
Coleman Edward M and Coleman Vera P
Current Estimated Value
Purchase Details
Closed on
Apr 17, 2015
Sold by
Coleman Edward M and Coleman Vera P
Bought by
Coleman Edwar M and Coleman Vera P
Purchase Details
Closed on
Dec 18, 2014
Sold by
Coleman Edward and Coleman Patricia
Bought by
Boyles Brenda and The Coleman Family Preservation Trusts
Purchase Details
Closed on
Jun 4, 2013
Sold by
Glenross Llc
Bought by
Coleman Edward and Coleman Vera Patricia
Purchase Details
Closed on
Oct 7, 2011
Sold by
Mid Ohio Development Landings Llc
Bought by
Glenross Llc
Home Financials for this Owner
Home Financials are based on the most recent Mortgage that was taken out on this home.
Original Mortgage
$1,980,000
Interest Rate
4.22%
Mortgage Type
Future Advance Clause Open End Mortgage
Create a Home Valuation Report for This Property
The Home Valuation Report is an in-depth analysis detailing your home's value as well as a comparison with similar homes in the area
Home Values in the Area
Average Home Value in this Area
Purchase History
| Date | Buyer | Sale Price | Title Company |
|---|---|---|---|
| Coleman Edward M | -- | Attorney | |
| Coleman Edwar M | -- | Attorney | |
| Boyles Brenda | -- | None Available | |
| Coleman Edward | $174,900 | Talon Title D | |
| Glenross Llc | $2,050,000 | Talon Title W |
Source: Public Records
Mortgage History
| Date | Status | Borrower | Loan Amount |
|---|---|---|---|
| Previous Owner | Glenross Llc | $1,980,000 |
Source: Public Records
Tax History Compared to Growth
Tax History
| Year | Tax Paid | Tax Assessment Tax Assessment Total Assessment is a certain percentage of the fair market value that is determined by local assessors to be the total taxable value of land and additions on the property. | Land | Improvement |
|---|---|---|---|---|
| 2024 | $5,189 | $105,390 | $22,230 | $83,160 |
| 2023 | $5,094 | $105,390 | $22,230 | $83,160 |
| 2022 | $4,327 | $72,980 | $17,500 | $55,480 |
| 2021 | $4,350 | $72,980 | $17,500 | $55,480 |
| 2020 | $4,589 | $72,980 | $17,500 | $55,480 |
| 2019 | $4,113 | $68,880 | $17,500 | $51,380 |
| 2018 | $4,130 | $68,880 | $17,500 | $51,380 |
| 2017 | $3,669 | $58,000 | $14,000 | $44,000 |
| 2016 | $3,576 | $58,000 | $14,000 | $44,000 |
| 2015 | $3,250 | $58,000 | $14,000 | $44,000 |
| 2014 | -- | $58,000 | $14,000 | $44,000 |
| 2013 | $3,885 | $56,700 | $14,000 | $42,700 |
Source: Public Records
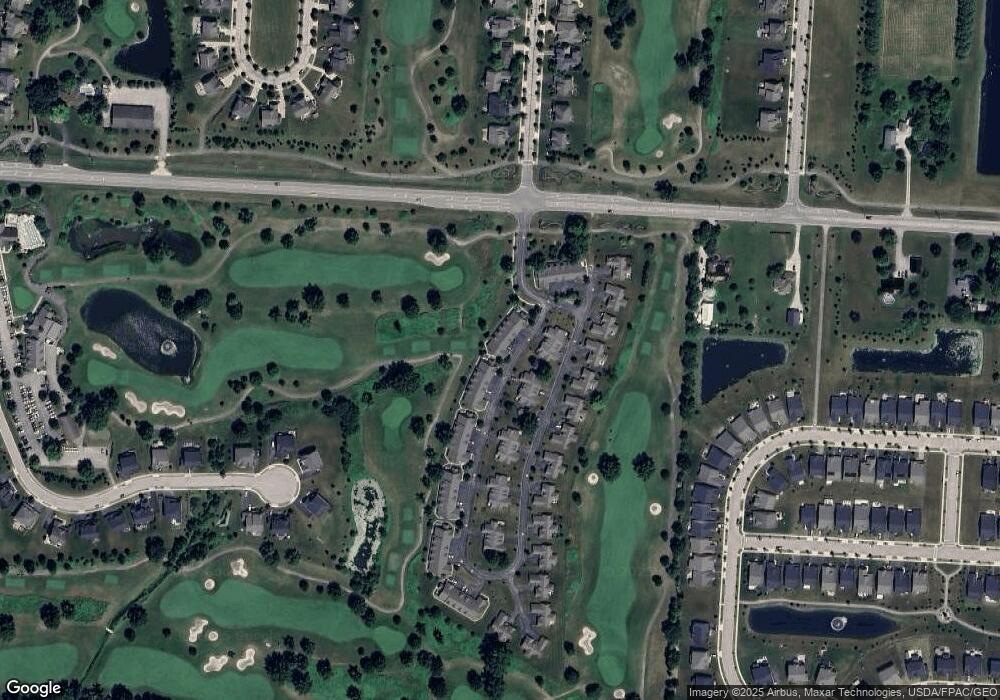
Map
Nearby Homes
- 145 Glen Mawr Cir
- 386 Stone Quarry Dr
- 331 Stone Quarry Dr
- 331 Harvest Walk Loop
- 349 Harvest Walk Loop
- Greenfield Plan at Glenross
- Newberry Plan at Glenross
- Ivy Plan at Glenross
- Hilltop Plan at Glenross
- Mercer Plan at Glenross
- Riverton Plan at Glenross
- Continental Plan at Glenross
- Waverly Plan at Glenross
- 643 Buena Park Dr
- 404 Colony Ridge Dr
- 336 Mcnamara Loop
- 592 Eagle Walk Rd
- 531 White Fawn Run
- 278 Indigo Blue St
- 401 Cherry Leaf Rd
- 7 Glen Mawr Cir
- 5 Glen Mawr Cir
- 5 Glen Mawr Cir
- 11 Glen Mawr Cir
- 11 Glen Mawr Cir
- 3 Glen Mawr Cir
- 3 Glen Mawr Cir
- 3 Glen Mawr Cir Unit 3
- 1 Glen Mawr Cir
- 1 Glen Mawr Cir
- 1310 Glen Mawr Cir
- 10 Glen Mawr Cir
- 15 Glen Mawr Cir
- 15 Glen Mawr Cir
- 2 Glen Mawr Cir
- 17 Glen Mawr Cir
- 13 Glen Mawr Cir
- 17 Glen Mawr Cir Unit 17
- 13 Glen Mawr Cir
- 112 Glen Mawr Cir