Estimated Value: $283,055 - $335,000
3
Beds
2
Baths
1,516
Sq Ft
$204/Sq Ft
Est. Value
About This Home
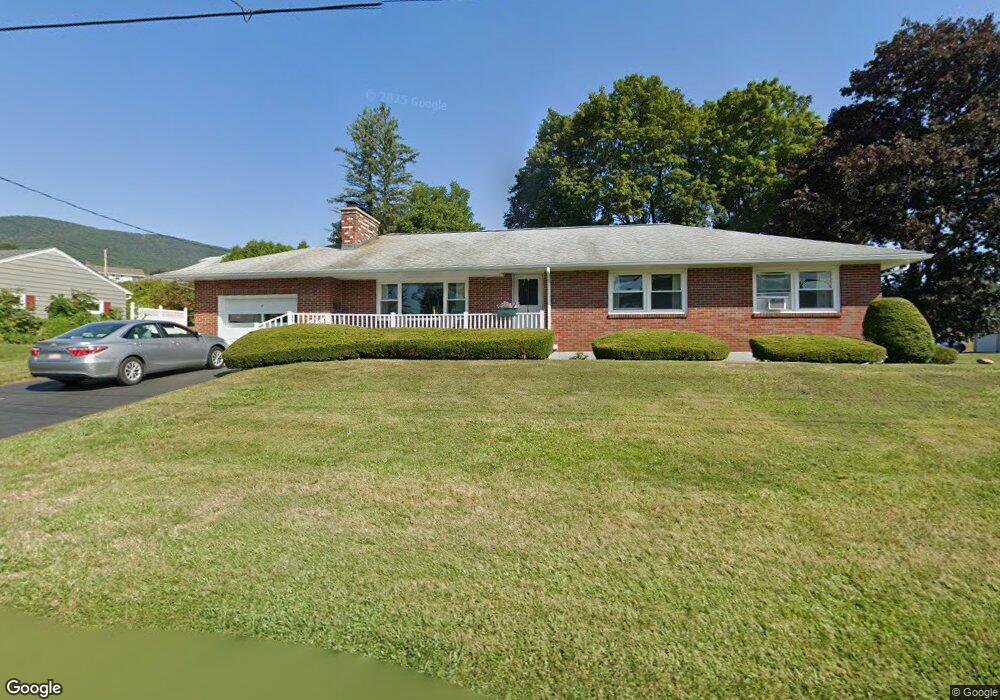
This home is located at 7 Grant St, Adams, MA 01220 and is currently estimated at $309,514, approximately $204 per square foot. 7 Grant St is a home located in Berkshire County with nearby schools including Hoosac Valley Middle & High School, Berkshire Arts & Technology Charter Public School, and St. Stanislaus Kostka School.
Ownership History
Date
Name
Owned For
Owner Type
Purchase Details
Closed on
Mar 17, 2022
Sold by
Solari Nancy J and Romaniak Gary A
Bought by
Kline John P and Kline Sarah J
Current Estimated Value
Home Financials for this Owner
Home Financials are based on the most recent Mortgage that was taken out on this home.
Original Mortgage
$199,920
Outstanding Balance
$184,932
Interest Rate
3.55%
Mortgage Type
Purchase Money Mortgage
Estimated Equity
$124,582
Purchase Details
Closed on
Feb 17, 2017
Sold by
Solari John E
Bought by
Solari Nancy J
Purchase Details
Closed on
Feb 13, 2017
Sold by
Solari Nancy J
Bought by
Solari John E and Solari Nancy J
Purchase Details
Closed on
Mar 22, 2010
Sold by
Solari Nancy J and Romaniak Gary A
Bought by
Romaniak Gary A and Solari Nancy J
Create a Home Valuation Report for This Property
The Home Valuation Report is an in-depth analysis detailing your home's value as well as a comparison with similar homes in the area
Home Values in the Area
Average Home Value in this Area
Purchase History
| Date | Buyer | Sale Price | Title Company |
|---|---|---|---|
| Kline John P | $249,900 | None Available | |
| Solari Nancy J | -- | -- | |
| Solari John E | -- | -- | |
| Romaniak Gary A | -- | -- | |
| Romaniak Gary A | -- | -- |
Source: Public Records
Mortgage History
| Date | Status | Borrower | Loan Amount |
|---|---|---|---|
| Open | Kline John P | $199,920 |
Source: Public Records
Tax History
| Year | Tax Paid | Tax Assessment Tax Assessment Total Assessment is a certain percentage of the fair market value that is determined by local assessors to be the total taxable value of land and additions on the property. | Land | Improvement |
|---|---|---|---|---|
| 2025 | $4,287 | $252,000 | $56,100 | $195,900 |
| 2024 | $4,039 | $230,300 | $52,800 | $177,500 |
| 2023 | $4,309 | $232,300 | $48,000 | $184,300 |
| 2022 | $4,191 | $200,600 | $41,700 | $158,900 |
| 2021 | $4,076 | $180,200 | $41,700 | $138,500 |
| 2020 | $3,984 | $182,100 | $42,200 | $139,900 |
| 2019 | $3,895 | $182,100 | $42,200 | $139,900 |
| 2018 | $3,987 | $179,500 | $42,200 | $137,300 |
| 2017 | $3,836 | $179,500 | $42,200 | $137,300 |
| 2016 | $3,514 | $164,300 | $42,200 | $122,100 |
| 2015 | $3,426 | $160,300 | $44,100 | $116,200 |
| 2014 | $3,198 | $160,300 | $44,100 | $116,200 |
Source: Public Records
Map
Nearby Homes
Your Personal Tour Guide
Ask me questions while you tour the home.