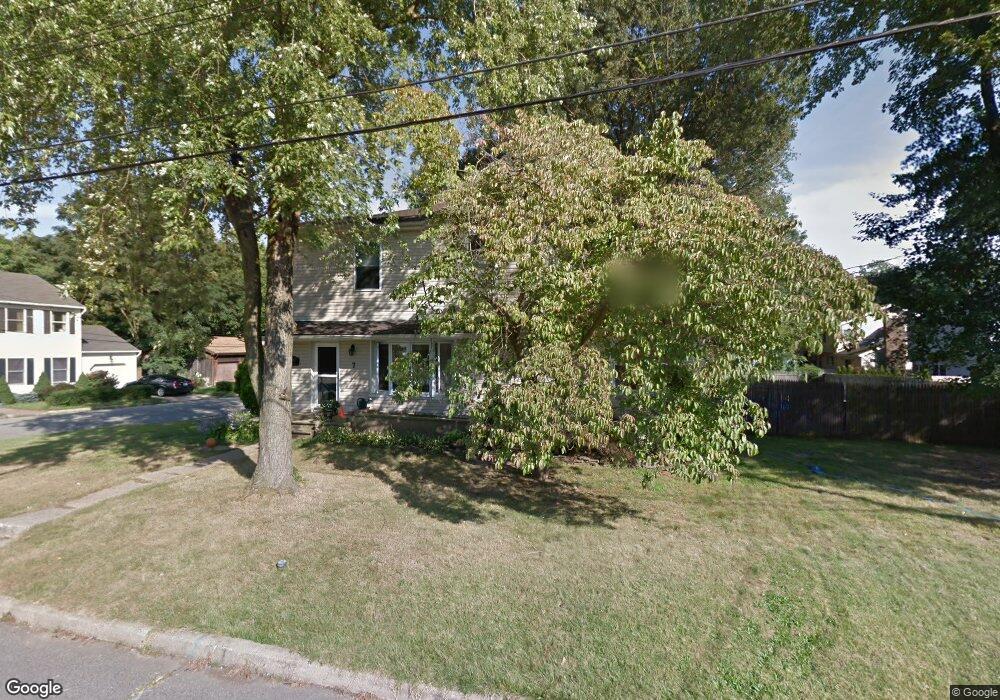
7 Grant St Matawan, NJ 07747
Estimated Value: $626,000 - $704,289
3
Beds
3
Baths
1,960
Sq Ft
$348/Sq Ft
Est. Value
About This Home
This home is located at 7 Grant St, Matawan, NJ 07747 and is currently estimated at $682,072, approximately $347 per square foot. 7 Grant St is a home located in Monmouth County with nearby schools including Matawan Reg High School, St. Joseph Elementary School, and Icob Academy.
Ownership History
Date
Name
Owned For
Owner Type
Purchase Details
Closed on
Sep 8, 1999
Sold by
Fedek Construction
Bought by
Jabbour George and Jabbour Susan
Current Estimated Value
Home Financials for this Owner
Home Financials are based on the most recent Mortgage that was taken out on this home.
Original Mortgage
$225,000
Interest Rate
7.73%
Purchase Details
Closed on
Jul 18, 1995
Sold by
Federal Home Loan Mortgage Corporation
Bought by
Leonard Dennis and Leonard Debra
Home Financials for this Owner
Home Financials are based on the most recent Mortgage that was taken out on this home.
Original Mortgage
$95,000
Interest Rate
7.61%
Create a Home Valuation Report for This Property
The Home Valuation Report is an in-depth analysis detailing your home's value as well as a comparison with similar homes in the area
Home Values in the Area
Average Home Value in this Area
Purchase History
| Date | Buyer | Sale Price | Title Company |
|---|---|---|---|
| Jabbour George | $125,000 | -- | |
| Leonard Dennis | $99,900 | -- |
Source: Public Records
Mortgage History
| Date | Status | Borrower | Loan Amount |
|---|---|---|---|
| Previous Owner | Jabbour George | $225,000 | |
| Previous Owner | Leonard Dennis | $95,000 |
Source: Public Records
Tax History Compared to Growth
Tax History
| Year | Tax Paid | Tax Assessment Tax Assessment Total Assessment is a certain percentage of the fair market value that is determined by local assessors to be the total taxable value of land and additions on the property. | Land | Improvement |
|---|---|---|---|---|
| 2025 | $12,773 | $636,900 | $310,000 | $326,900 |
| 2024 | $12,444 | $585,100 | $325,000 | $260,100 |
| 2023 | $12,444 | $572,400 | $315,000 | $257,400 |
| 2022 | $11,612 | $482,200 | $237,000 | $245,200 |
| 2021 | $8,642 | $427,400 | $204,000 | $223,400 |
| 2020 | $11,343 | $414,600 | $194,000 | $220,600 |
| 2019 | $11,062 | $405,200 | $190,000 | $215,200 |
| 2018 | $11,031 | $397,500 | $185,000 | $212,500 |
| 2017 | $10,793 | $383,400 | $175,000 | $208,400 |
| 2016 | $10,354 | $375,700 | $170,000 | $205,700 |
| 2015 | $9,641 | $352,500 | $155,000 | $197,500 |
| 2014 | $9,655 | $354,300 | $150,000 | $204,300 |
Source: Public Records
Map
Nearby Homes