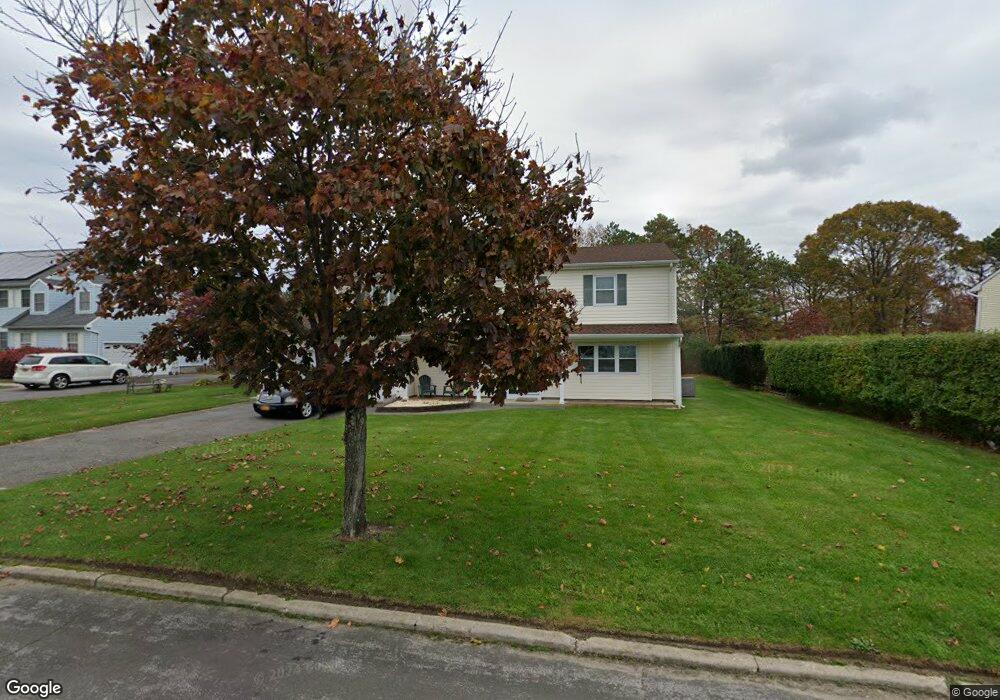
7 Gregg St East Patchogue, NY 11772
Estimated Value: $622,645 - $763,000
4
Beds
2
Baths
2,439
Sq Ft
$275/Sq Ft
Est. Value
About This Home
This home is located at 7 Gregg St, East Patchogue, NY 11772 and is currently estimated at $670,411, approximately $274 per square foot. 7 Gregg St is a home located in Suffolk County with nearby schools including Frank P Long Intermediate School, Bellport Middle School, and Bellport Senior High School.
Ownership History
Date
Name
Owned For
Owner Type
Purchase Details
Closed on
Dec 7, 2009
Sold by
Malley Jane C O
Bought by
Lindo Judi E
Current Estimated Value
Home Financials for this Owner
Home Financials are based on the most recent Mortgage that was taken out on this home.
Original Mortgage
$246,000
Outstanding Balance
$161,277
Interest Rate
5%
Mortgage Type
Purchase Money Mortgage
Estimated Equity
$509,134
Purchase Details
Closed on
Jan 10, 1997
Sold by
Mcfarlane Kirk D and Mcfarlane Barbara
Bought by
Omalley Jane C
Create a Home Valuation Report for This Property
The Home Valuation Report is an in-depth analysis detailing your home's value as well as a comparison with similar homes in the area
Home Values in the Area
Average Home Value in this Area
Purchase History
| Date | Buyer | Sale Price | Title Company |
|---|---|---|---|
| Lindo Judi E | $307,500 | -- | |
| Omalley Jane C | $120,000 | Chicago Title Insurance Co |
Source: Public Records
Mortgage History
| Date | Status | Borrower | Loan Amount |
|---|---|---|---|
| Open | Lindo Judi E | $246,000 |
Source: Public Records
Tax History
| Year | Tax Paid | Tax Assessment Tax Assessment Total Assessment is a certain percentage of the fair market value that is determined by local assessors to be the total taxable value of land and additions on the property. | Land | Improvement |
|---|---|---|---|---|
| 2024 | $9,876 | $2,552 | $300 | $2,252 |
| 2023 | $9,876 | $2,552 | $300 | $2,252 |
| 2022 | $8,716 | $2,552 | $300 | $2,252 |
| 2021 | $8,716 | $2,552 | $300 | $2,252 |
| 2020 | $9,086 | $2,552 | $300 | $2,252 |
| 2019 | $9,086 | $0 | $0 | $0 |
| 2018 | $8,474 | $2,552 | $300 | $2,252 |
| 2017 | $8,474 | $2,552 | $300 | $2,252 |
| 2016 | $8,443 | $2,552 | $300 | $2,252 |
| 2015 | -- | $2,552 | $300 | $2,252 |
| 2014 | -- | $2,552 | $300 | $2,252 |
Source: Public Records
Map
Nearby Homes
Your Personal Tour Guide
Ask me questions while you tour the home.