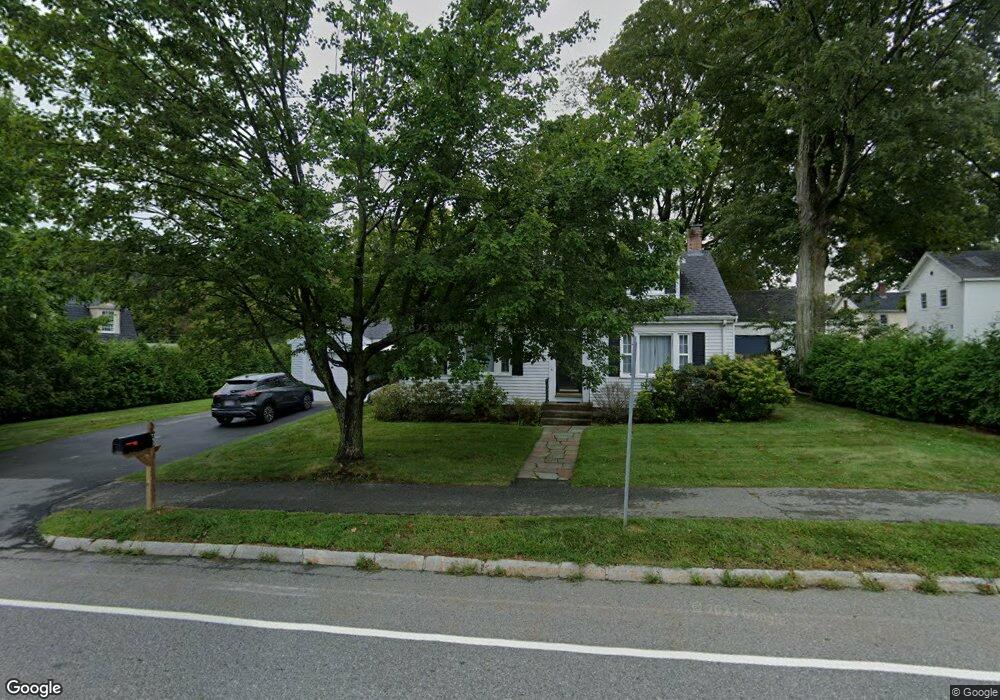
7 Grove St Fayville, MA 01745
Estimated Value: $552,000 - $896,000
2
Beds
2
Baths
2,296
Sq Ft
$308/Sq Ft
Est. Value
About This Home
This home is located at 7 Grove St, Fayville, MA 01745 and is currently estimated at $707,719, approximately $308 per square foot. 7 Grove St is a home located in Worcester County with nearby schools including Albert S. Woodward Memorial School, Margaret A. Neary School, and P. Brent Trottier Middle School.
Ownership History
Date
Name
Owned For
Owner Type
Purchase Details
Closed on
Jul 30, 1992
Sold by
Baltic Rlty Corp
Bought by
Burnell David A
Current Estimated Value
Purchase Details
Closed on
Mar 12, 1991
Sold by
Grossman Jeffrey A
Bought by
Baltic Realty Corp
Create a Home Valuation Report for This Property
The Home Valuation Report is an in-depth analysis detailing your home's value as well as a comparison with similar homes in the area
Home Values in the Area
Average Home Value in this Area
Purchase History
| Date | Buyer | Sale Price | Title Company |
|---|---|---|---|
| Burnell David A | $150,000 | -- | |
| Burnell David A | $150,000 | -- | |
| Baltic Realty Corp | $100,000 | -- | |
| Baltic Realty Corp | $100,000 | -- |
Source: Public Records
Mortgage History
| Date | Status | Borrower | Loan Amount |
|---|---|---|---|
| Open | Baltic Realty Corp | $80,000 | |
| Closed | Baltic Realty Corp | $80,000 | |
| Closed | Baltic Realty Corp | $11,000 |
Source: Public Records
Tax History Compared to Growth
Tax History
| Year | Tax Paid | Tax Assessment Tax Assessment Total Assessment is a certain percentage of the fair market value that is determined by local assessors to be the total taxable value of land and additions on the property. | Land | Improvement |
|---|---|---|---|---|
| 2025 | $7,558 | $547,300 | $265,600 | $281,700 |
| 2024 | $7,219 | $519,000 | $265,600 | $253,400 |
| 2023 | $7,080 | $479,700 | $246,600 | $233,100 |
| 2022 | $6,712 | $412,300 | $218,600 | $193,700 |
| 2021 | $10,174 | $372,300 | $202,400 | $169,900 |
| 2020 | $5,954 | $357,400 | $187,500 | $169,900 |
| 2019 | $7,685 | $355,000 | $175,500 | $179,500 |
| 2018 | $5,421 | $335,900 | $170,800 | $165,100 |
| 2017 | $8,748 | $325,600 | $170,800 | $154,800 |
| 2016 | $5,211 | $329,400 | $170,500 | $158,900 |
| 2015 | $5,197 | $324,400 | $154,600 | $169,800 |
Source: Public Records
Map
Nearby Homes
- 9 Cherry St
- 7 John St
- 1 Carriage Hill Cir Unit 1
- 216 Boston Rd
- 1 Blueberry Ln
- 40 William Onthank Ln
- 38 William Onthank Ln
- 21 William Onthank Ln
- 8 Lorenzo Dr
- 36 E Main St
- 14 Pinehill Rd
- 58 Framingham Rd
- 23 Stonebrook Ct Unit 11
- 6 Witherbee Ln
- 9 John Matthews Rd
- 24 Angelica Dr
- 7 Rockpoint Rd
- 43 Edgewood Rd
- 0 Oregon Rd
- 10 Foothill Rd
- 9 Grove St
- 6 Cherry St
- 46 Central St
- 8 Cherry St
- 12 Cherry St
- 50 Central St Unit 2
- 50 Central St
- 50 Central St Unit B
- 50 Central St Unit A
- 50 Central St Unit 1
- 7 Cherry St
- 16 Cherry St
- 54 Central St
- 15 Cherry St
- 45 Central St
- 11 Cherry St
- 47 Central St
- 56 Central St
- 3 Pleasant St
- 3 Pleasant St Unit 3C