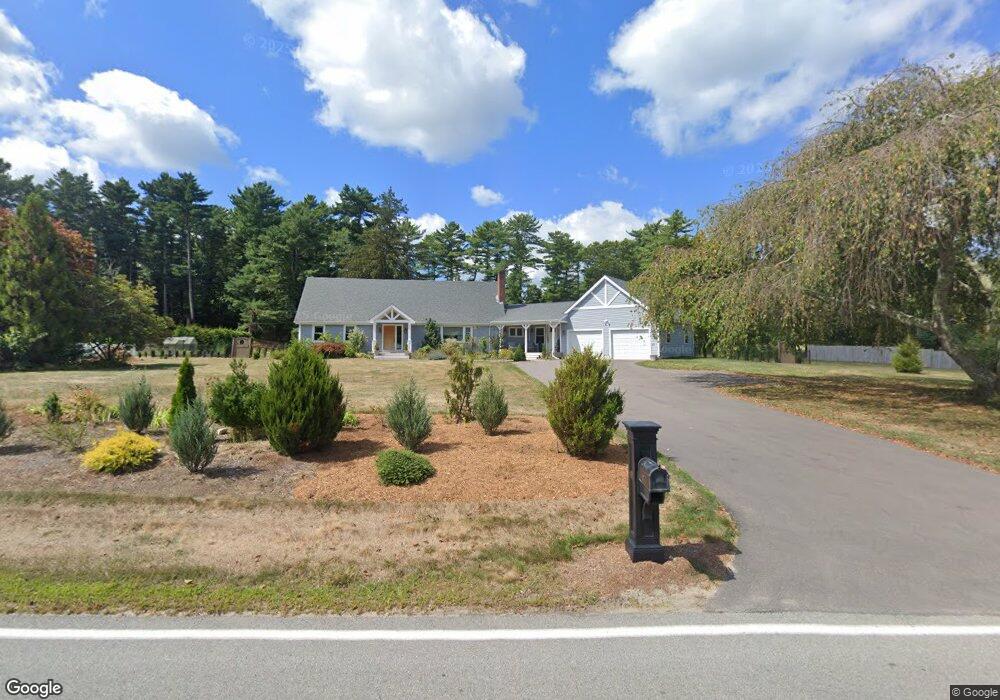
7 Gurney Rd East Freetown, MA 02717
Estimated Value: $598,000 - $798,000
3
Beds
3
Baths
2,812
Sq Ft
$249/Sq Ft
Est. Value
About This Home
This home is located at 7 Gurney Rd, East Freetown, MA 02717 and is currently estimated at $700,119, approximately $248 per square foot. 7 Gurney Rd is a home located in Bristol County with nearby schools including Freetown Elementary School, George R Austin Intermediate School, and Freetown-Lakeville Middle School.
Ownership History
Date
Name
Owned For
Owner Type
Purchase Details
Closed on
Sep 27, 2019
Sold by
Cabucio Laura and Bard Lance J
Bought by
Alice I Gurney Irt
Current Estimated Value
Purchase Details
Closed on
Sep 24, 2019
Sold by
Alice I Gurney Irt
Bought by
Cabucio Laura and Bard Lance J
Purchase Details
Closed on
Jul 9, 2019
Sold by
Alice I Gurney Irt
Bought by
Cabucio Laura and Bard Lance J
Purchase Details
Closed on
Oct 19, 2018
Sold by
Alice I Gurney Irt
Bought by
Cabucio Laura and Bard Lance J
Home Financials for this Owner
Home Financials are based on the most recent Mortgage that was taken out on this home.
Original Mortgage
$320,000
Interest Rate
4.5%
Mortgage Type
New Conventional
Purchase Details
Closed on
Aug 12, 2013
Sold by
Gurney Ft and Cabucio Anne M
Bought by
Alice I Gurney Irt and Cabucio Anne M
Purchase Details
Closed on
Mar 31, 2011
Sold by
Gurmey Richard H and Gurmey Alice I
Bought by
Gurney Ft
Create a Home Valuation Report for This Property
The Home Valuation Report is an in-depth analysis detailing your home's value as well as a comparison with similar homes in the area
Home Values in the Area
Average Home Value in this Area
Purchase History
| Date | Buyer | Sale Price | Title Company |
|---|---|---|---|
| Alice I Gurney Irt | -- | -- | |
| Cabucio Laura | -- | -- | |
| Cabucio Laura | -- | -- | |
| Cabucio Laura | $300,000 | -- | |
| Alice I Gurney Irt | -- | -- | |
| Gurney Ft | -- | -- |
Source: Public Records
Mortgage History
| Date | Status | Borrower | Loan Amount |
|---|---|---|---|
| Previous Owner | Cabucio Laura | $320,000 |
Source: Public Records
Tax History Compared to Growth
Tax History
| Year | Tax Paid | Tax Assessment Tax Assessment Total Assessment is a certain percentage of the fair market value that is determined by local assessors to be the total taxable value of land and additions on the property. | Land | Improvement |
|---|---|---|---|---|
| 2025 | $6,493 | $655,200 | $187,200 | $468,000 |
| 2024 | $6,451 | $618,500 | $176,600 | $441,900 |
| 2023 | $6,357 | $593,600 | $159,000 | $434,600 |
| 2022 | $6,055 | $502,100 | $134,700 | $367,400 |
| 2021 | $5,636 | $443,800 | $122,500 | $321,300 |
| 2020 | $5,677 | $436,000 | $117,900 | $318,100 |
| 2019 | $3,890 | $295,800 | $112,200 | $183,600 |
| 2018 | $3,679 | $276,400 | $112,200 | $164,200 |
| 2017 | $3,611 | $271,100 | $112,200 | $158,900 |
| 2016 | $3,445 | $263,200 | $109,000 | $154,200 |
| 2015 | $3,386 | $262,500 | $109,000 | $153,500 |
| 2014 | $2,864 | $227,100 | $106,700 | $120,400 |
Source: Public Records
Map
Nearby Homes
- 11 Gurney Rd
- 23 Parker Dr
- 0 Costa Dr
- 8 Denise Ave
- 144 Chace Rd
- 24 Bells Brook Rd
- 19 Hilltop Acres Dr
- 4597 Acushnet Ave
- 3 Elaine Ave
- 36 Winfield St
- 1599 Braley Rd Unit 68
- 1573 Braley Rd Unit 39
- Lot 2 Sherwood Ln
- Lot 1 Sherwood Ln
- 2 Hayes St
- 120 Hackett Ave
- 15 Morrison Way
- 1 Elaine Cir
- 595 Quanapoag Rd
- 599 Quanapoag Rd