
Seller's Agent in 2024
Jennifer Adelman
Real Broker MA, LLC
(508) 944-4954
36 Total Sales
Estimated Value: $423,000 - $499,000
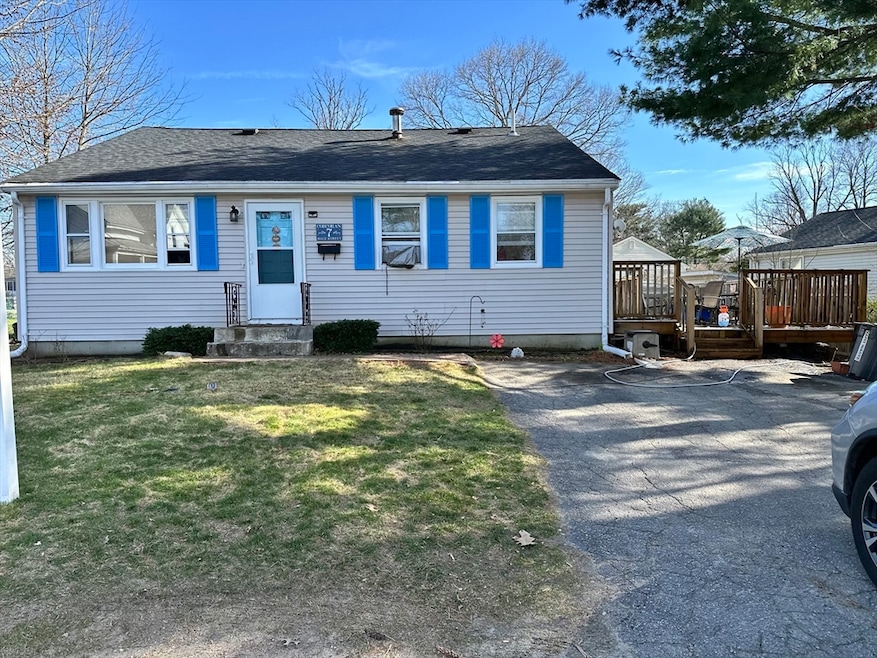
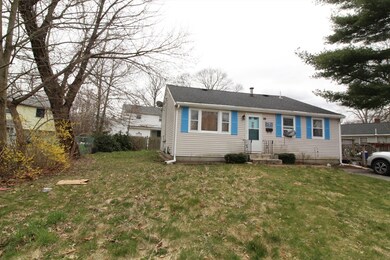
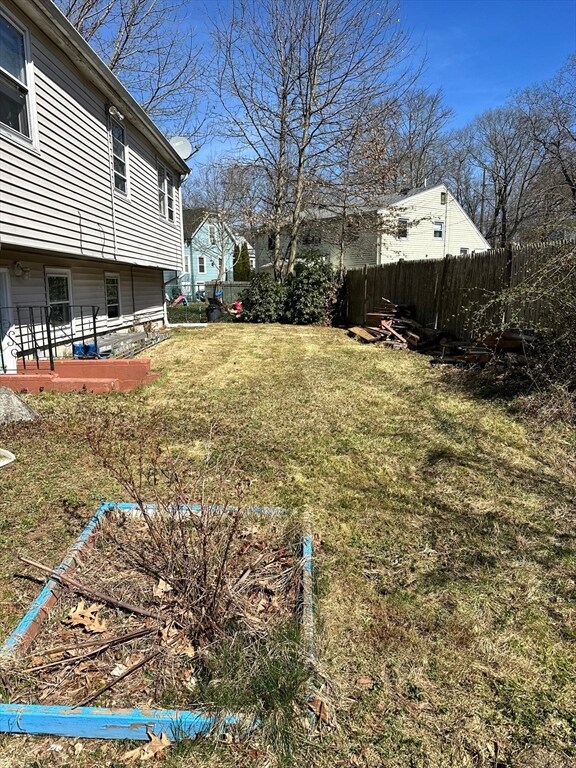
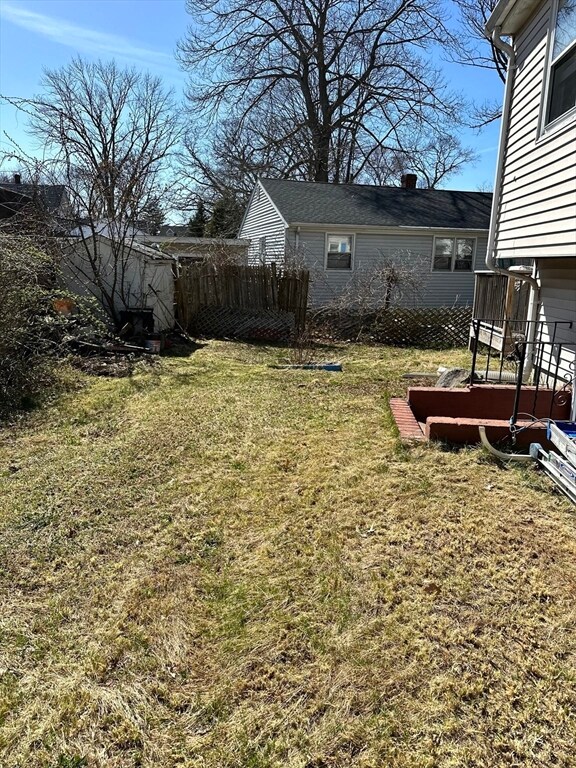
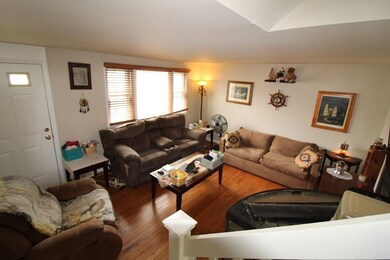
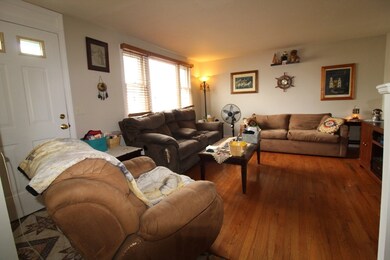
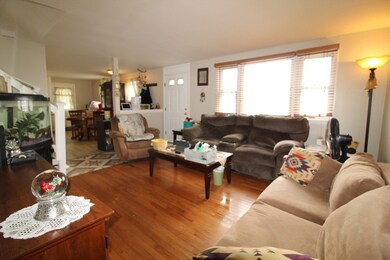
All offers to be submitted by 5:00 pm Monday night. Just a little attention will go a long way here...and this seller is ready to make a big move. The house has a 7 y.o. roof, new hot water tank 2022, Its not easy in this market to find a good starter home that you can gain equity on. Come check this out. Location on the east side, last house on a lil' dead end street. Easy access to everything! The T, shopping, public schools, Massasoit, Brockton Hospital, all within a few minutes!
| Date | Buyer | Sale Price | Title Company |
|---|---|---|---|
| Corcoran Alton E | $220,000 | -- | |
| Jean-Philippe Marie T | $205,000 | -- | |
| Lasalle Bank Na Tr | $204,350 | -- | |
| Dash Nicole J | $230,000 | -- | |
| Cruz Migna L | $132,900 | -- | |
| Jean-Philippe Marie T | $205,000 | -- | |
| Lasalle Bank Na Tr | $204,350 | -- | |
| Dash Nicole J | $230,000 | -- | |
| Cruz Migna L | $132,900 | -- |
| Date | Status | Borrower | Loan Amount |
|---|---|---|---|
| Open | Corcoran Alton E | $216,015 | |
| Closed | Cruz Migna L | $216,015 |
| Date | Event | Price | List to Sale | Price per Sq Ft | Prior Sale |
|---|---|---|---|---|---|
| 06/28/2024 06/28/24 | Sold | $445,000 | +11.3% | $318 / Sq Ft | |
| 04/16/2024 04/16/24 | Pending | -- | -- | -- | |
| 04/14/2024 04/14/24 | For Sale | $399,900 | 0.0% | $285 / Sq Ft | |
| 04/14/2024 04/14/24 | Off Market | $399,900 | -- | -- | |
| 04/10/2024 04/10/24 | For Sale | $399,900 | +81.8% | $285 / Sq Ft | |
| 06/30/2016 06/30/16 | Sold | $220,000 | -2.2% | $157 / Sq Ft | View Prior Sale |
| 04/28/2016 04/28/16 | Pending | -- | -- | -- | |
| 04/14/2016 04/14/16 | For Sale | $225,000 | -- | $161 / Sq Ft |
| Year | Tax Paid | Tax Assessment Tax Assessment Total Assessment is a certain percentage of the fair market value that is determined by local assessors to be the total taxable value of land and additions on the property. | Land | Improvement |
|---|---|---|---|---|
| 2025 | $5,178 | $427,600 | $137,600 | $290,000 |
| 2024 | $4,934 | $410,500 | $137,600 | $272,900 |
| 2023 | $4,939 | $380,500 | $102,700 | $277,800 |
| 2022 | $4,294 | $307,400 | $93,200 | $214,200 |
| 2021 | $4,336 | $299,000 | $77,100 | $221,900 |
| 2020 | $3,980 | $262,700 | $72,600 | $190,100 |
| 2019 | $4,006 | $257,800 | $70,400 | $187,400 |
| 2018 | $3,581 | $223,000 | $70,400 | $152,600 |
| 2017 | $3,091 | $192,000 | $70,400 | $121,600 |
| 2016 | $3,302 | $190,200 | $68,200 | $122,000 |
| 2015 | $2,929 | $161,400 | $68,200 | $93,200 |
| 2014 | $3,084 | $170,100 | $68,200 | $101,900 |
Seller's Agent in 2024
Jennifer Adelman
Real Broker MA, LLC
(508) 944-4954
36 Total Sales
Buyer's Agent in 2024
Nirva Cantave
Cantave Realty Group, Inc.
(617) 602-3477
1 Total Sale
Seller's Agent in 2016
Ruth Littleton
Littleton Realty Group
(508) 889-6550
38 Total Sales
Source: MLS Property Information Network (MLS PIN)
MLS Number: 73221996
APN: BROC-000139-000090
Disclaimer: Certain information contained herein is derived from information provided by parties other than Homes.com. All information provided is deemed reliable, but is not guaranteed to be accurate and should be independently verified.
![]() The property listing data and information, or the Images, set forth herein were provided to MLS Property Information Network, Inc. from third party sources, including sellers, lessors and public records, and were compiled by MLS Property Information Network, Inc. The property listing data and information, and the Images, are for the personal, non-commercial use of consumers having a good faith interest in purchasing or leasing listed properties of the type displayed to them and may not be used for any purpose other than to identify prospective properties which such consumers may have a good faith interest in purchasing or leasing. MLS Property Information Network, Inc. and its subscribers disclaim any and all representations and warranties as to the accuracy of the property listing data and information, or as to the accuracy of any of the Images, set forth herein.
The property listing data and information, or the Images, set forth herein were provided to MLS Property Information Network, Inc. from third party sources, including sellers, lessors and public records, and were compiled by MLS Property Information Network, Inc. The property listing data and information, and the Images, are for the personal, non-commercial use of consumers having a good faith interest in purchasing or leasing listed properties of the type displayed to them and may not be used for any purpose other than to identify prospective properties which such consumers may have a good faith interest in purchasing or leasing. MLS Property Information Network, Inc. and its subscribers disclaim any and all representations and warranties as to the accuracy of the property listing data and information, or as to the accuracy of any of the Images, set forth herein.