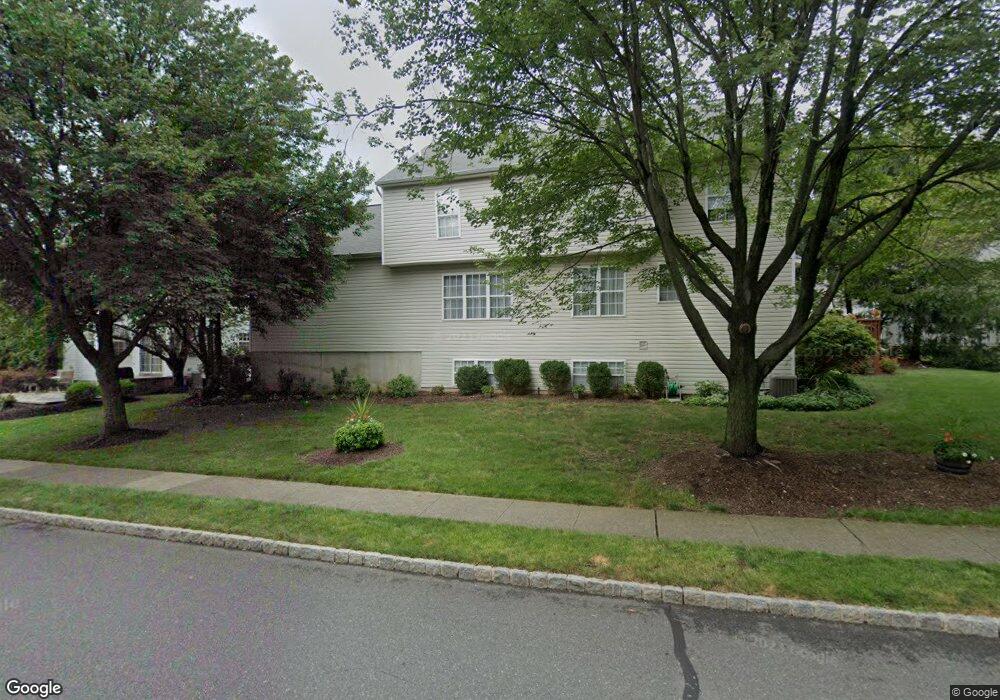
7 Hansom Rd Basking Ridge, NJ 07920
Estimated Value: $1,059,660 - $1,168,000
Studio
--
Bath
2,648
Sq Ft
$416/Sq Ft
Est. Value
About This Home
This home is located at 7 Hansom Rd, Basking Ridge, NJ 07920 and is currently estimated at $1,101,915, approximately $416 per square foot. 7 Hansom Rd is a home located in Somerset County with nearby schools including Mount Prospect Elementary School, William Annin Middle School, and Ridge High School.
Ownership History
Date
Name
Owned For
Owner Type
Purchase Details
Closed on
Apr 30, 1998
Sold by
Pulte Home Corporation
Bought by
Duerschmidt Julian D and Duerschmidt Ellen M
Current Estimated Value
Home Financials for this Owner
Home Financials are based on the most recent Mortgage that was taken out on this home.
Original Mortgage
$288,000
Outstanding Balance
$55,980
Interest Rate
7.04%
Estimated Equity
$1,045,935
Create a Home Valuation Report for This Property
The Home Valuation Report is an in-depth analysis detailing your home's value as well as a comparison with similar homes in the area
Home Values in the Area
Average Home Value in this Area
Purchase History
| Date | Buyer | Sale Price | Title Company |
|---|---|---|---|
| Duerschmidt Julian D | $359,522 | -- |
Source: Public Records
Mortgage History
| Date | Status | Borrower | Loan Amount |
|---|---|---|---|
| Open | Duerschmidt Julian D | $288,000 |
Source: Public Records
Tax History
| Year | Tax Paid | Tax Assessment Tax Assessment Total Assessment is a certain percentage of the fair market value that is determined by local assessors to be the total taxable value of land and additions on the property. | Land | Improvement |
|---|---|---|---|---|
| 2025 | $15,397 | $1,046,200 | $309,600 | $736,600 |
| 2024 | $15,397 | $865,500 | $279,600 | $585,900 |
| 2023 | $15,761 | $835,700 | $279,600 | $556,100 |
| 2022 | $15,676 | $779,500 | $279,600 | $499,900 |
| 2021 | $15,029 | $747,800 | $284,400 | $463,400 |
| 2020 | $15,282 | $729,800 | $284,400 | $445,400 |
| 2019 | $15,462 | $760,200 | $284,400 | $475,800 |
| 2018 | $15,874 | $791,700 | $284,400 | $507,300 |
| 2017 | $15,890 | $798,900 | $284,400 | $514,500 |
| 2016 | $15,748 | $807,200 | $294,400 | $512,800 |
| 2015 | $14,532 | $771,500 | $294,400 | $477,100 |
| 2014 | $13,775 | $725,200 | $294,400 | $430,800 |
Source: Public Records
Map
Nearby Homes
- 21 Dorchester Dr
- 82 Constitution Way Unit 24E
- 234 Patriot Hill Dr
- 66 Patriot Hill Dr Unit 1
- 66 Patriot Hill Dr
- 266 Patriot Hill Dr
- 14 Tory Ct
- 80 N Edgewood Rd
- 13 Spencer Ln
- 85 Encampment Dr
- 48 Morgan Ct
- 7 Watchung Dr
- 32 Spruce Ct Unit 13032
- 12 Sentinel Dr
- 47 Spruce Ct
- 32 Morgan Ct
- 64 Encampment Dr
- 74 Academy Ct
- 12 Encampment Dr
- 8 Encampment Dr
Your Personal Tour Guide
Ask me questions while you tour the home.