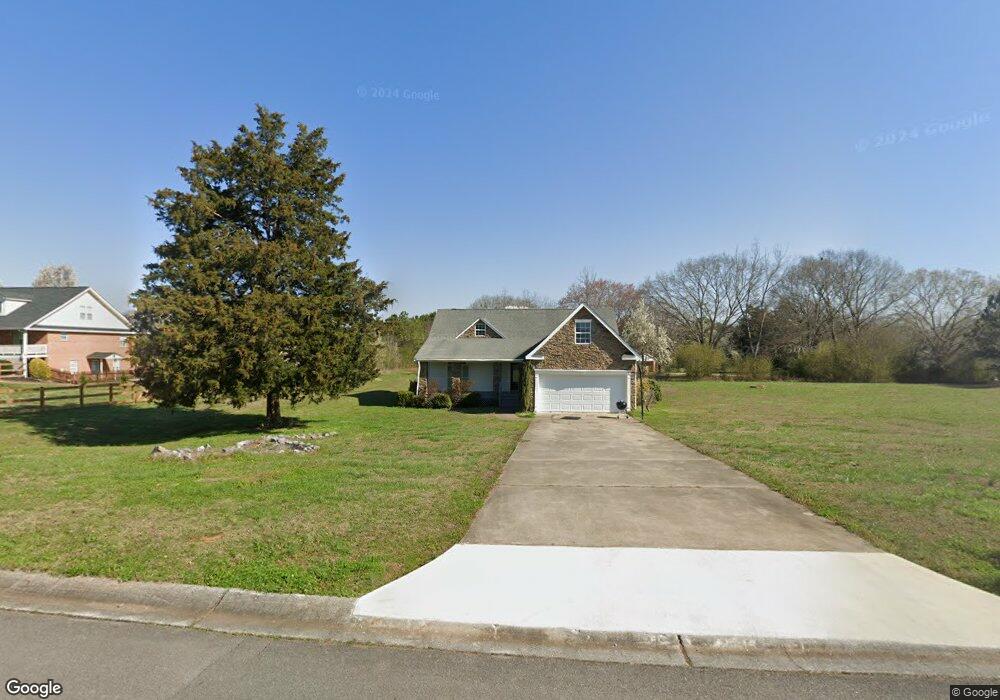
7 Herchel Mize Dr SW Cave Spring, GA 30124
Estimated Value: $270,000 - $274,000
--
Bed
3
Baths
1,768
Sq Ft
$154/Sq Ft
Est. Value
About This Home
This home is located at 7 Herchel Mize Dr SW, Cave Spring, GA 30124 and is currently estimated at $272,396, approximately $154 per square foot. 7 Herchel Mize Dr SW is a home located in Floyd County with nearby schools including Coosa Middle School and Coosa High School.
Ownership History
Date
Name
Owned For
Owner Type
Purchase Details
Closed on
Oct 14, 2022
Sold by
Phillips Brothers Acquisitions Llc
Bought by
Templeman Mareena and Hoesing Gary Harold
Current Estimated Value
Home Financials for this Owner
Home Financials are based on the most recent Mortgage that was taken out on this home.
Original Mortgage
$193,070
Outstanding Balance
$185,764
Interest Rate
6.02%
Mortgage Type
FHA
Estimated Equity
$86,632
Purchase Details
Closed on
Jun 14, 2022
Sold by
Holtzclaw Frank
Bought by
Phillips Brothers Acquisitions Llc
Home Financials for this Owner
Home Financials are based on the most recent Mortgage that was taken out on this home.
Original Mortgage
$135,000
Interest Rate
5.25%
Mortgage Type
New Conventional
Purchase Details
Closed on
Mar 27, 2006
Sold by
Not Provided
Bought by
Holtzclaw Frank
Create a Home Valuation Report for This Property
The Home Valuation Report is an in-depth analysis detailing your home's value as well as a comparison with similar homes in the area
Home Values in the Area
Average Home Value in this Area
Purchase History
| Date | Buyer | Sale Price | Title Company |
|---|---|---|---|
| Templeman Mareena | $235,000 | -- | |
| Phillips Brothers Acquisitions Llc | $150,000 | -- | |
| Holtzclaw Frank | $30,000 | -- |
Source: Public Records
Mortgage History
| Date | Status | Borrower | Loan Amount |
|---|---|---|---|
| Open | Templeman Mareena | $193,070 | |
| Previous Owner | Phillips Brothers Acquisitions Llc | $135,000 |
Source: Public Records
Tax History Compared to Growth
Tax History
| Year | Tax Paid | Tax Assessment Tax Assessment Total Assessment is a certain percentage of the fair market value that is determined by local assessors to be the total taxable value of land and additions on the property. | Land | Improvement |
|---|---|---|---|---|
| 2024 | $2,601 | $92,906 | $8,400 | $84,506 |
| 2023 | $2,444 | $90,627 | $8,400 | $82,227 |
| 2022 | $2,189 | $80,002 | $8,000 | $72,002 |
| 2021 | $1,901 | $68,172 | $8,000 | $60,172 |
| 2020 | $1,844 | $65,541 | $8,000 | $57,541 |
| 2019 | $1,589 | $60,338 | $8,000 | $52,338 |
| 2018 | $1,493 | $56,772 | $8,000 | $48,772 |
| 2017 | $1,413 | $53,765 | $8,000 | $45,765 |
| 2016 | $1,407 | $52,950 | $8,000 | $44,950 |
| 2015 | $1,375 | $52,950 | $8,000 | $44,950 |
| 2014 | $1,375 | $52,950 | $8,000 | $44,950 |
Source: Public Records
Map
Nearby Homes
- 7 Herschel Mize Dr SW
- 7 Herschel Mize Dr
- 5677 Fosters Mill Rd SW
- 22 River St SW
- 5598 Fosters Mill Rd
- 104 Fincher St
- 57 Mill St
- 0 Mill Rd Unit 10629874
- 0 Mill Rd Unit 7670319
- 10 Ridge Rd SW
- 8876 Cave Spring Rd SW
- 0 Melson Rd SW Unit 7676052
- 0 Melson Rd SW Unit 10636997
- 907 Gadsden Rd SW
- 8876 Cave Spring
- 123 Santa Claus Rd
- 424 Michael Blvd
- 2053 Buttermilk Rd SW
- 0 McGee Bend Rd SW Unit 10351960
- 383 Valley Grove Rd
- 2 David Dr
- 0 Heather Cir Unit Lot-41 8278962
- 0 Heather Cir Unit Lot-40 8278940
- 0 Heather Cir Unit Lot-39 8278912
- 0 Heather Cir Unit 5926173
- 0 Heather Cir Unit 5926147
- 0 Heather Cir Unit Lot-35 8278791
- 0 Heather Cir Unit Lot-38 8278793
- 0 Heather Cir Unit Lot-14 8278509
- 0 Heather Cir Unit Lot-13 8278478
- 0 Heather Cir Unit 5926126
- 0 Heather Cir Unit 5926048
- 0 Heather Cir Unit 5926046
- 0 Heather Cir Unit 5925801
- 0 Heather Cir Unit 5925790
- 0 Heather Cir Unit 5925550
- 0 Heather Cir Unit 5925549
- 0 Heather Cir Unit Lot-10 8278181
- 0 Heather Cir Unit Lot-9 8278178
- 0 Heather Cir Unit 5925489