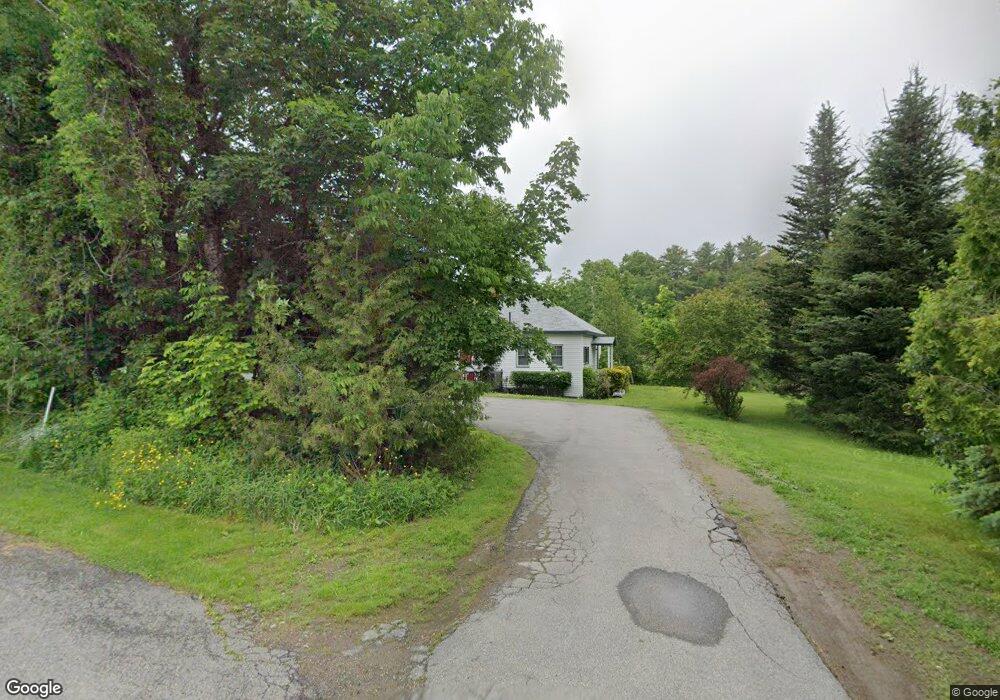
7 Herrick Rd Camden, ME 04843
Estimated Value: $300,000 - $395,405
1
Bed
1
Bath
952
Sq Ft
$367/Sq Ft
Est. Value
About This Home
This home is located at 7 Herrick Rd, Camden, ME 04843 and is currently estimated at $349,851, approximately $367 per square foot. 7 Herrick Rd is a home located in Knox County with nearby schools including Camden-Rockport Elementary School, Camden-Rockport Middle School, and Camden Hills Regional High School.
Ownership History
Date
Name
Owned For
Owner Type
Purchase Details
Closed on
Aug 24, 2009
Sold by
Stearns Randall B and Stearns Brenda M
Bought by
Medina Kandice R
Current Estimated Value
Home Financials for this Owner
Home Financials are based on the most recent Mortgage that was taken out on this home.
Original Mortgage
$148,500
Outstanding Balance
$96,724
Interest Rate
5.19%
Mortgage Type
Purchase Money Mortgage
Estimated Equity
$253,127
Create a Home Valuation Report for This Property
The Home Valuation Report is an in-depth analysis detailing your home's value as well as a comparison with similar homes in the area
Home Values in the Area
Average Home Value in this Area
Purchase History
| Date | Buyer | Sale Price | Title Company |
|---|---|---|---|
| Medina Kandice R | -- | -- |
Source: Public Records
Mortgage History
| Date | Status | Borrower | Loan Amount |
|---|---|---|---|
| Open | Medina Kandice R | $148,500 |
Source: Public Records
Tax History
| Year | Tax Paid | Tax Assessment Tax Assessment Total Assessment is a certain percentage of the fair market value that is determined by local assessors to be the total taxable value of land and additions on the property. | Land | Improvement |
|---|---|---|---|---|
| 2024 | $3,852 | $366,900 | $118,500 | $248,400 |
| 2023 | $3,200 | $231,900 | $49,400 | $182,500 |
| 2022 | $3,061 | $231,900 | $49,400 | $182,500 |
| 2021 | $2,462 | $160,400 | $50,000 | $110,400 |
| 2020 | $2,411 | $160,400 | $50,000 | $110,400 |
| 2019 | $2,392 | $160,400 | $50,000 | $110,400 |
| 2018 | $2,433 | $163,500 | $47,400 | $116,100 |
| 2017 | $2,351 | $163,500 | $47,400 | $116,100 |
| 2016 | $2,395 | $153,600 | $52,400 | $101,200 |
| 2015 | $2,324 | $153,600 | $52,400 | $101,200 |
| 2014 | $2,216 | $153,600 | $52,400 | $101,200 |
| 2013 | $2,157 | $153,600 | $52,400 | $101,200 |
Source: Public Records
Map
Nearby Homes
Your Personal Tour Guide
Ask me questions while you tour the home.