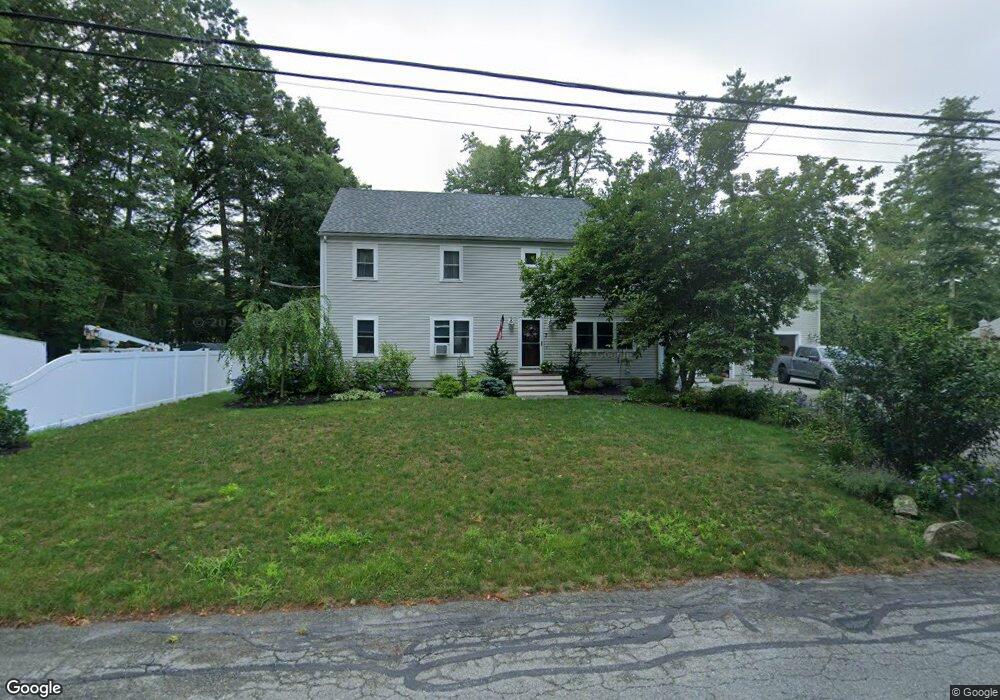
7 Hiawatha Way Mattapoisett, MA 02739
Estimated Value: $639,000 - $772,000
4
Beds
2
Baths
2,634
Sq Ft
$271/Sq Ft
Est. Value
About This Home
This home is located at 7 Hiawatha Way, Mattapoisett, MA 02739 and is currently estimated at $713,924, approximately $271 per square foot. 7 Hiawatha Way is a home located in Plymouth County with nearby schools including Center School, Old Hammondtown Elementary, and Old Rochester Regional High School.
Ownership History
Date
Name
Owned For
Owner Type
Purchase Details
Closed on
Mar 5, 2004
Sold by
Mchenry Elizabeth A and Pelletier Elizabeth A
Bought by
Mello Kevin A and Mello Amy S
Current Estimated Value
Home Financials for this Owner
Home Financials are based on the most recent Mortgage that was taken out on this home.
Original Mortgage
$265,000
Outstanding Balance
$123,415
Interest Rate
5.62%
Mortgage Type
Purchase Money Mortgage
Estimated Equity
$590,509
Purchase Details
Closed on
Feb 24, 2003
Sold by
Pelletier Jean A and Mchenry Elizabeth A
Bought by
Mchenry Elizabeth A
Create a Home Valuation Report for This Property
The Home Valuation Report is an in-depth analysis detailing your home's value as well as a comparison with similar homes in the area
Home Values in the Area
Average Home Value in this Area
Purchase History
| Date | Buyer | Sale Price | Title Company |
|---|---|---|---|
| Mello Kevin A | $340,000 | -- | |
| Mello Kevin A | $340,000 | -- | |
| Mchenry Elizabeth A | -- | -- | |
| Mchenry Elizabeth A | -- | -- |
Source: Public Records
Mortgage History
| Date | Status | Borrower | Loan Amount |
|---|---|---|---|
| Open | Mchenry Elizabeth A | $65,000 | |
| Open | Mchenry Elizabeth A | $265,000 | |
| Closed | Mchenry Elizabeth A | $265,000 |
Source: Public Records
Tax History Compared to Growth
Tax History
| Year | Tax Paid | Tax Assessment Tax Assessment Total Assessment is a certain percentage of the fair market value that is determined by local assessors to be the total taxable value of land and additions on the property. | Land | Improvement |
|---|---|---|---|---|
| 2025 | $6,316 | $587,000 | $183,200 | $403,800 |
| 2024 | $5,459 | $519,400 | $183,200 | $336,200 |
| 2023 | $5,437 | $483,300 | $163,500 | $319,800 |
| 2022 | $5,656 | $456,100 | $136,300 | $319,800 |
| 2021 | $5,312 | $409,900 | $151,400 | $258,500 |
| 2020 | $5,114 | $379,100 | $144,200 | $234,900 |
| 2019 | $4,984 | $377,300 | $144,200 | $233,100 |
| 2018 | $4,575 | $351,400 | $127,700 | $223,700 |
| 2017 | $4,331 | $331,400 | $127,700 | $203,700 |
| 2016 | $4,400 | $333,300 | $134,000 | $199,300 |
| 2015 | $4,164 | $320,300 | $127,700 | $192,600 |
| 2014 | $3,993 | $313,900 | $127,700 | $186,200 |
Source: Public Records
Map
Nearby Homes
- 224 North St
- 1 Crooked Bow Path
- 7 Laura Ln
- 8 Abby Ln
- 220 Mattapoisett Rd
- 0 Long Plain Rd
- 225 Mattapoisett Rd
- 2 Golf Cottage Way
- 4 Golf Cottage Way
- 170 Dexter Ln
- 293 Mendall Rd
- 286 Mendall Rd
- 6 Golf Cottage Way
- 19 High Ridge Dr
- 13 Park Place
- 4 Hayley Cir
- 2 Hayley Cir
- 10 Gosnold St
- 10 Shagbark Cr
- 19 Sarahbeth Ln Unit 27