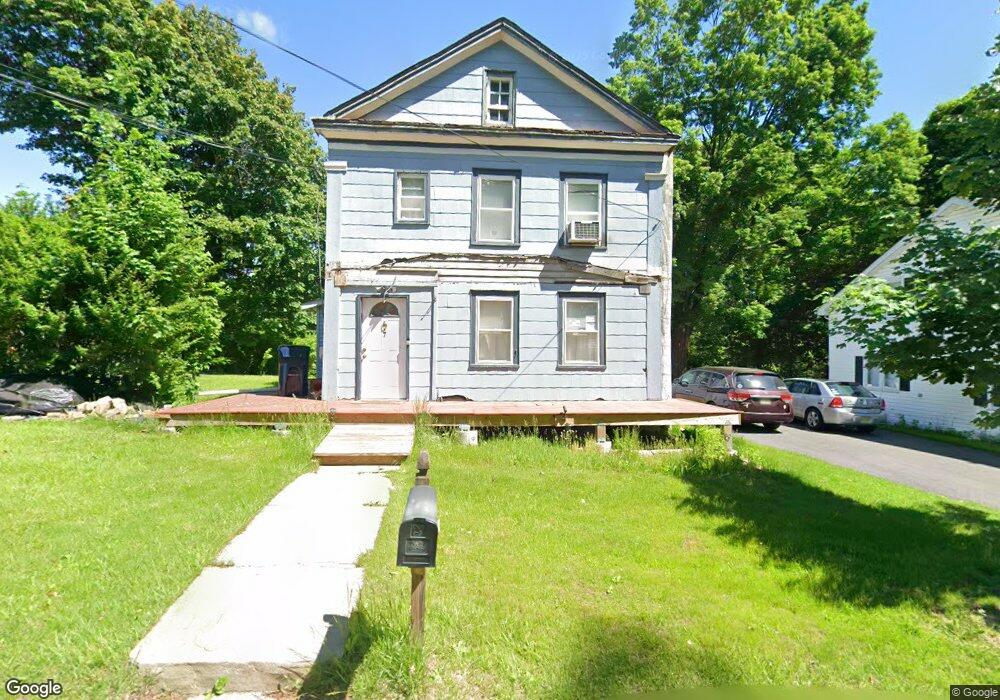
7 High St Andover, NJ 07821
Estimated Value: $355,426 - $478,000
Studio
--
Bath
1,950
Sq Ft
$210/Sq Ft
Est. Value
About This Home
This home is located at 7 High St, Andover, NJ 07821 and is currently estimated at $410,357, approximately $210 per square foot. 7 High St is a home located in Sussex County with nearby schools including Florence M. Burd School, Long Pond School, and Tranquility Adventist School.
Ownership History
Date
Name
Owned For
Owner Type
Purchase Details
Closed on
Mar 8, 1994
Sold by
Eick William
Bought by
Dehaas William
Current Estimated Value
Home Financials for this Owner
Home Financials are based on the most recent Mortgage that was taken out on this home.
Original Mortgage
$95,000
Interest Rate
7.01%
Create a Home Valuation Report for This Property
The Home Valuation Report is an in-depth analysis detailing your home's value as well as a comparison with similar homes in the area
Home Values in the Area
Average Home Value in this Area
Purchase History
| Date | Buyer | Sale Price | Title Company |
|---|---|---|---|
| Dehaas William | $101,000 | -- |
Source: Public Records
Mortgage History
| Date | Status | Borrower | Loan Amount |
|---|---|---|---|
| Closed | Dehaas William | $95,000 |
Source: Public Records
Tax History
| Year | Tax Paid | Tax Assessment Tax Assessment Total Assessment is a certain percentage of the fair market value that is determined by local assessors to be the total taxable value of land and additions on the property. | Land | Improvement |
|---|---|---|---|---|
| 2025 | $6,882 | $211,700 | $86,500 | $125,200 |
| 2024 | $6,857 | $211,700 | $86,500 | $125,200 |
Source: Public Records
Map
Nearby Homes
- 17 High St
- 5 Winding Way
- 1 Brandon Ct
- 8 Cub Lake Rd
- 26 Hemlock Rd
- 00 Forest Lakes Dr
- 6 Jans Way
- 153 Forest Lake Dr N
- 96 Brighton Rd
- 5 Percy Place
- 52 Whitehall Rd
- 56A Sleepy Hollow Rd
- 74 Sleepy Hollow Rd
- 10 Sunny Ln
- 31 Penn Ave
- 41 Kilroy Rd
- 30 MacKerley Rd
- 190 Andover Mohawk Rd
- 0 Decker Pond Airport Rd Unit 3945534
- 7 Martin St
Your Personal Tour Guide
Ask me questions while you tour the home.