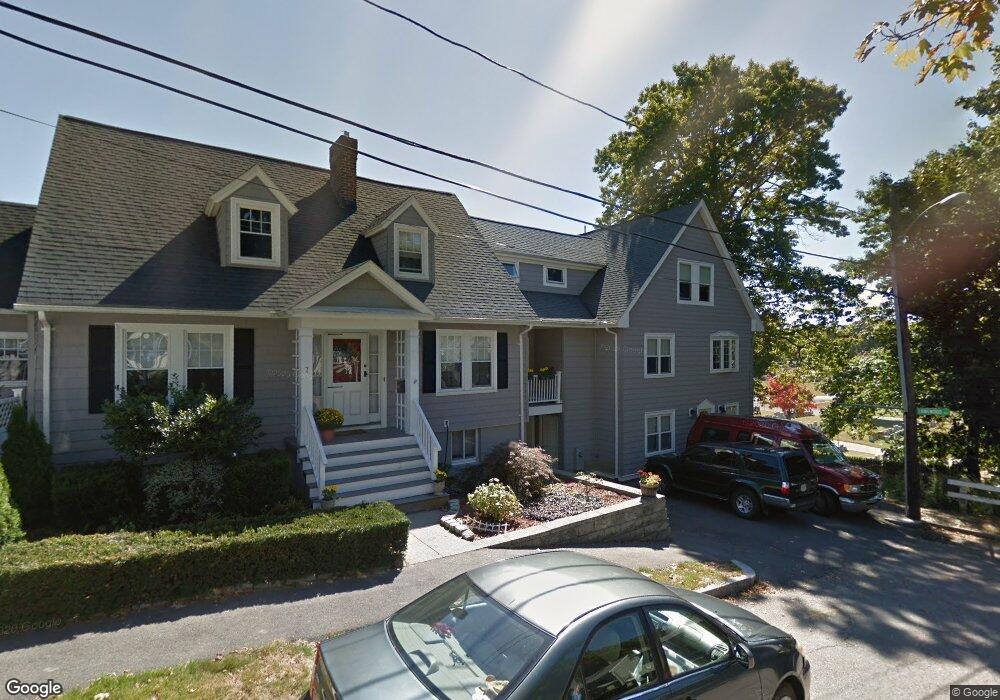
7 Highfield Rd Quincy, MA 02169
Merrymount NeighborhoodEstimated Value: $1,022,000 - $1,284,000
2
Beds
3
Baths
4,153
Sq Ft
$276/Sq Ft
Est. Value
About This Home
This home is located at 7 Highfield Rd, Quincy, MA 02169 and is currently estimated at $1,144,472, approximately $275 per square foot. 7 Highfield Rd is a home located in Norfolk County with nearby schools including Merrymount Elementary School, Central Middle School, and Quincy High School.
Ownership History
Date
Name
Owned For
Owner Type
Purchase Details
Closed on
Dec 1, 1987
Sold by
Morrison Margaret
Bought by
Mcdonagh Edward M
Current Estimated Value
Home Financials for this Owner
Home Financials are based on the most recent Mortgage that was taken out on this home.
Original Mortgage
$130,000
Interest Rate
11.59%
Mortgage Type
Purchase Money Mortgage
Create a Home Valuation Report for This Property
The Home Valuation Report is an in-depth analysis detailing your home's value as well as a comparison with similar homes in the area
Home Values in the Area
Average Home Value in this Area
Purchase History
| Date | Buyer | Sale Price | Title Company |
|---|---|---|---|
| Mcdonagh Edward M | $165,500 | -- |
Source: Public Records
Mortgage History
| Date | Status | Borrower | Loan Amount |
|---|---|---|---|
| Closed | Mcdonagh Edward M | $129,000 | |
| Closed | Mcdonagh Edward M | $130,000 | |
| Closed | Mcdonagh Edward M | $130,000 |
Source: Public Records
Tax History
| Year | Tax Paid | Tax Assessment Tax Assessment Total Assessment is a certain percentage of the fair market value that is determined by local assessors to be the total taxable value of land and additions on the property. | Land | Improvement |
|---|---|---|---|---|
| 2025 | $12,140 | $1,052,900 | $381,000 | $671,900 |
| 2024 | $11,676 | $1,036,000 | $370,000 | $666,000 |
| 2023 | $10,509 | $944,200 | $321,700 | $622,500 |
| 2022 | $10,919 | $911,400 | $268,100 | $643,300 |
| 2021 | $10,213 | $841,300 | $268,100 | $573,200 |
| 2020 | $10,430 | $839,100 | $257,800 | $581,300 |
| 2019 | $9,455 | $753,400 | $240,900 | $512,500 |
| 2018 | $6,625 | $496,600 | $200,000 | $296,600 |
| 2017 | $6,547 | $462,000 | $209,400 | $252,600 |
| 2016 | $6,170 | $429,700 | $205,700 | $224,000 |
| 2015 | $5,846 | $400,400 | $194,000 | $206,400 |
| 2014 | $5,466 | $367,800 | $188,300 | $179,500 |
Source: Public Records
Map
Nearby Homes
- 105 Sea St Unit 105
- 105 Sea St Unit 102
- 148 Furnace Brook Pkwy
- 270 Southern Artery
- 33 Virginia Rd
- 40 Virginia Rd
- 245 Sea St Unit 45
- 74 Butler Rd
- 44 Armory St
- 10 Edgemere Rd
- 20 Whitney Rd Unit 7
- 20 Whitney Rd Unit 1
- 1025 Hancock St Unit 11M
- 66 Mcgrath Hwy Unit 502
- 66 Mcgrath Hwy Unit 411
- 66 Mcgrath Hwy Unit 404
- 66 Mcgrath Hwy Unit 507
- 59 Spear St Unit 301
- 59 Spear St Unit 202
- 999 Hancock St Unit 402
- 5 Overlook Rd
- 9 Overlook Rd
- 81 Longwood Rd
- 11 Overlook Rd
- 12 Highfield Rd
- 4 Overlook Rd
- 8 Highfield Rd
- 77 Longwood Rd
- 17 Overlook Rd
- 76 Longwood Rd
- 51 Ridgeway Dr
- 17 Highfield Rd Unit 1
- 19 Highfield Rd
- 19 Highfield Rd Unit 1
- 73 Longwood Rd
- 21 Overlook Rd
- 43 Ridgeway Dr
- 72 Longwood Rd
- 18 Overlook Rd
- 69 Longwood Rd
Your Personal Tour Guide
Ask me questions while you tour the home.