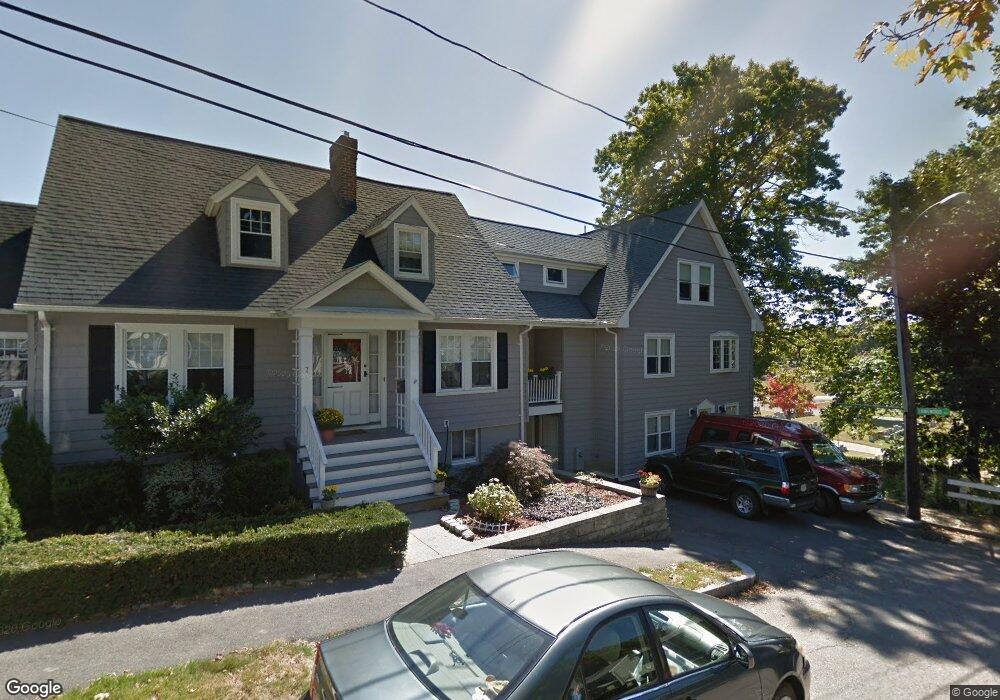
7 Highfield Rd Quincy, MA 02169
Merrymount NeighborhoodEstimated Value: $1,061,000 - $1,445,000
About This Home
This home is located at 7 Highfield Rd, Quincy, MA 02169 and is currently estimated at $1,241,475, approximately $298 per square foot. 7 Highfield Rd is a home located in Norfolk County with nearby schools including Merrymount Elementary School, Central Middle School, and Quincy High School.
Ownership History
We collect this data history from publicly available records. To have your information removed, we recommend requesting removal directly through your county’s website.
Purchase Details
Home Financials for this Owner
Home Financials are based on the most recent Mortgage that was taken out on this home.Home Values in the Area
Average Home Value in this Area
Purchase History
We collect this data history from publicly available records. To have your information removed, we recommend requesting removal directly through your county’s website.
| Date | Buyer | Sale Price | Title Company |
|---|---|---|---|
| $165,500 | -- |
Mortgage History
We collect this data history from publicly available records. To have your information removed, we recommend requesting removal directly through your county’s website.
| Date | Status | Borrower | Loan Amount |
|---|---|---|---|
| Closed | $129,000 | ||
| Closed | $130,000 | ||
| Closed | $130,000 |
Tax History
We collect this data history from publicly available records. To have your information removed, we recommend requesting removal directly through your county’s website.
| Year | Tax Paid | Tax Assessment Tax Assessment Total Assessment is a certain percentage of the fair market value that is determined by local assessors to be the total taxable value of land and additions on the property. | Land | Improvement |
|---|---|---|---|---|
| 2025 | $12,140 | $1,052,900 | $381,000 | $671,900 |
| 2024 | $11,676 | $1,036,000 | $370,000 | $666,000 |
| 2023 | $10,509 | $944,200 | $321,700 | $622,500 |
| 2022 | $10,919 | $911,400 | $268,100 | $643,300 |
| 2021 | $10,213 | $841,300 | $268,100 | $573,200 |
| 2020 | $10,430 | $839,100 | $257,800 | $581,300 |
| 2019 | $9,455 | $753,400 | $240,900 | $512,500 |
| 2018 | $6,625 | $496,600 | $200,000 | $296,600 |
| 2017 | $6,547 | $462,000 | $209,400 | $252,600 |
| 2016 | $6,170 | $429,700 | $205,700 | $224,000 |
| 2015 | $5,846 | $400,400 | $194,000 | $206,400 |
| 2014 | $5,466 | $367,800 | $188,300 | $179,500 |
Map
- 105 Sea St Unit 302
- 105 Sea St Unit 101
- 105 Sea St Unit 104
- 81 Assabet Rd
- 168 Furnace Brook Pkwy
- 44 Chickatabot Rd
- 74 Butler Rd
- 10 Edgemere Rd
- 44 Greenleaf St
- 1025 Hancock St Unit 14F
- 1025 Hancock St Unit 2P
- 77 Adams St Unit 611
- 77 Adams St Unit 610
- 77 Adams St Unit 1102
- 66 Mcgrath Hwy Unit 509
- 66 Mcgrath Hwy Unit 401
- 66 Mcgrath Hwy Unit 501
- 66 Mcgrath Hwy Unit 510
- 66 Mcgrath Hwy Unit 205
- 66 Mcgrath Hwy Unit 303
- 51 Ridgeway Dr
- 12 Highfield Rd
- 43 Ridgeway Dr
- 17 Highfield Rd Unit 1
- 39 Ridgeway Dr
- 1405 Quincy Shore Dr
- 22 Highfield Rd
- 8 Highfield Rd
- 76 Longwood Rd
- 4 Overlook Rd
- 19 Highfield Rd
- 19 Highfield Rd Unit 1
- 72 Longwood Rd
- 38 Ridgeway Dr
- 35 Ridgeway Dr
- 1411 Quincy Shore Dr
- 1417 Quincy Shore Dr
- 5 Overlook Rd
- 66 Longwood Rd
- 1399 Quincy Shore Dr
Ask me questions while you tour the home.