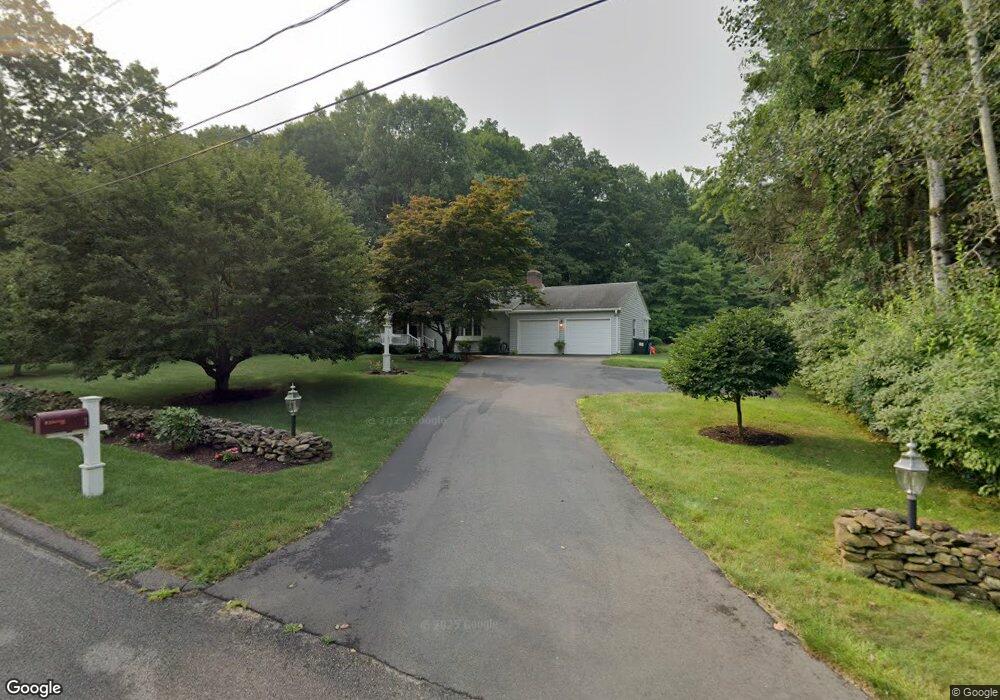
7 Highmoor Dr Wilbraham, MA 01095
Estimated Value: $410,000 - $451,000
3
Beds
2
Baths
1,664
Sq Ft
$259/Sq Ft
Est. Value
About This Home
This home is located at 7 Highmoor Dr, Wilbraham, MA 01095 and is currently estimated at $430,530, approximately $258 per square foot. 7 Highmoor Dr is a home located in Hampden County with nearby schools including Minnechaug Regional High School, Springfield International Charter School, and Wilbraham & Monson Academy.
Ownership History
Date
Name
Owned For
Owner Type
Purchase Details
Closed on
Feb 23, 2024
Sold by
Tremblay Michelle and Tremblay Robert S
Bought by
Robert S Tremblay Ret and Tremblay
Current Estimated Value
Purchase Details
Closed on
Feb 25, 1991
Sold by
Stone Shirley W
Bought by
Tremblay Robert S and Tremblay Michelle E
Create a Home Valuation Report for This Property
The Home Valuation Report is an in-depth analysis detailing your home's value as well as a comparison with similar homes in the area
Home Values in the Area
Average Home Value in this Area
Purchase History
| Date | Buyer | Sale Price | Title Company |
|---|---|---|---|
| Robert S Tremblay Ret | -- | None Available | |
| Tremblay Robert S | $140,000 | -- |
Source: Public Records
Mortgage History
| Date | Status | Borrower | Loan Amount |
|---|---|---|---|
| Previous Owner | Tremblay Robert S | $35,038 | |
| Previous Owner | Tremblay Robert S | $160,000 | |
| Previous Owner | Tremblay Robert S | $20,000 |
Source: Public Records
Tax History
| Year | Tax Paid | Tax Assessment Tax Assessment Total Assessment is a certain percentage of the fair market value that is determined by local assessors to be the total taxable value of land and additions on the property. | Land | Improvement |
|---|---|---|---|---|
| 2025 | $6,712 | $375,400 | $102,000 | $273,400 |
| 2024 | $6,442 | $348,200 | $102,000 | $246,200 |
| 2023 | $5,836 | $325,700 | $102,000 | $223,700 |
| 2022 | $5,836 | $284,800 | $102,000 | $182,800 |
| 2021 | $5,469 | $238,200 | $108,900 | $129,300 |
| 2020 | $5,331 | $238,200 | $108,900 | $129,300 |
| 2019 | $5,193 | $238,200 | $108,900 | $129,300 |
| 2018 | $4,942 | $218,300 | $108,900 | $109,400 |
| 2017 | $4,803 | $218,300 | $108,900 | $109,400 |
| 2016 | $4,879 | $225,900 | $121,200 | $104,700 |
| 2015 | $4,717 | $225,900 | $121,200 | $104,700 |
Source: Public Records
Map
Nearby Homes
- 24 Mcintosh Dr
- 6 Katie St
- 230V Burleigh Rd
- 6 Hilltop Park
- 85 Baldwin Dr
- 107 Baldwin Dr
- 8 Patriot Ridge Ln
- 5 Edgewood Rd
- 1070 Glendale Rd
- 474 Mountain Rd
- 20 Old Orchard Rd
- 733 Monson Rd
- 25 Angelica Dr
- 745 Glendale Rd
- 6 Brooklawn Rd
- 140 Slumber Ln
- 0 Mountain Rd Unit 73267162
- 0 Mountain Rd Unit 72942534
- 325 Allen St
- 474-480 Mountain Rd
Your Personal Tour Guide
Ask me questions while you tour the home.