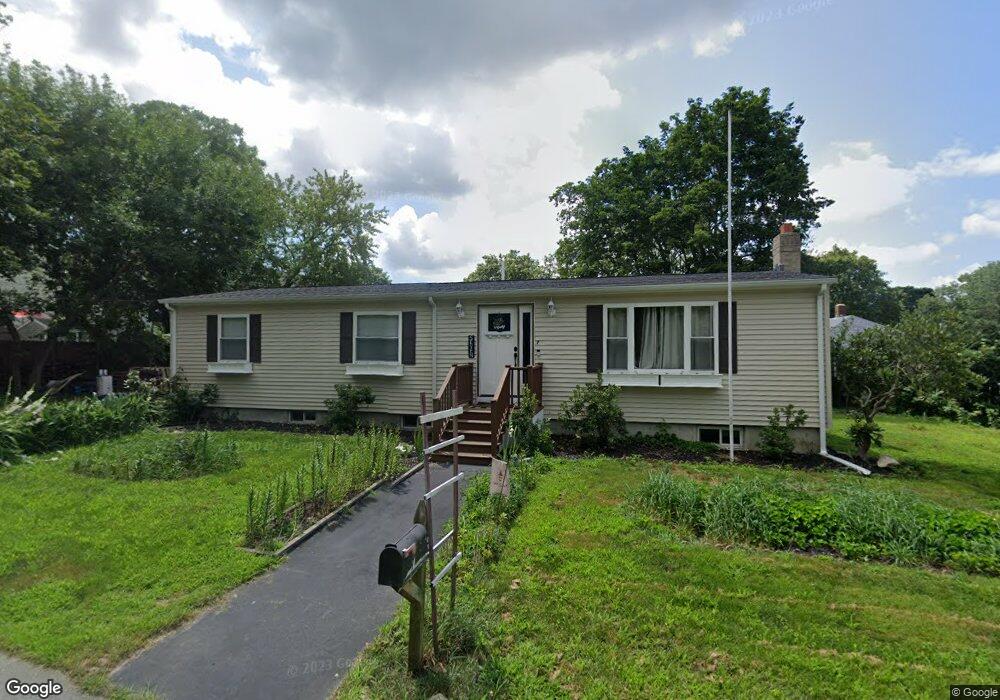
7 Hill St Unit 1 Acushnet, MA 02743
Upper Acushnet NeighborhoodEstimated Value: $442,000 - $545,000
3
Beds
2
Baths
1,968
Sq Ft
$245/Sq Ft
Est. Value
About This Home
This home is located at 7 Hill St Unit 1, Acushnet, MA 02743 and is currently estimated at $482,940, approximately $245 per square foot. 7 Hill St Unit 1 is a home located in Bristol County with nearby schools including Acushnet Elementary School, Albert F Ford Middle School, and Alma Del Mar Charter School.
Ownership History
Date
Name
Owned For
Owner Type
Purchase Details
Closed on
Sep 28, 2022
Sold by
Valente Agostinho S and Valente Maria T
Bought by
Tonetto Courtney M
Current Estimated Value
Home Financials for this Owner
Home Financials are based on the most recent Mortgage that was taken out on this home.
Original Mortgage
$276,000
Outstanding Balance
$263,052
Interest Rate
5.13%
Mortgage Type
Purchase Money Mortgage
Estimated Equity
$219,888
Purchase Details
Closed on
Oct 13, 1995
Sold by
Lowe Philip
Bought by
Valente Agostinho S and Valente Maria T
Purchase Details
Closed on
Feb 8, 1995
Sold by
Houle Germaine
Bought by
Lowe Philip
Create a Home Valuation Report for This Property
The Home Valuation Report is an in-depth analysis detailing your home's value as well as a comparison with similar homes in the area
Home Values in the Area
Average Home Value in this Area
Purchase History
| Date | Buyer | Sale Price | Title Company |
|---|---|---|---|
| Tonetto Courtney M | $386,000 | None Available | |
| Valente Agostinho S | $106,500 | -- | |
| Lowe Philip | $40,000 | -- |
Source: Public Records
Mortgage History
| Date | Status | Borrower | Loan Amount |
|---|---|---|---|
| Open | Tonetto Courtney M | $276,000 | |
| Previous Owner | Lowe Philip | $76,000 | |
| Previous Owner | Lowe Philip | $76,000 | |
| Previous Owner | Lowe Philip | $30,000 |
Source: Public Records
Tax History Compared to Growth
Tax History
| Year | Tax Paid | Tax Assessment Tax Assessment Total Assessment is a certain percentage of the fair market value that is determined by local assessors to be the total taxable value of land and additions on the property. | Land | Improvement |
|---|---|---|---|---|
| 2025 | $44 | $405,000 | $91,100 | $313,900 |
| 2024 | $4,081 | $357,700 | $86,800 | $270,900 |
| 2023 | $3,954 | $329,500 | $78,400 | $251,100 |
| 2022 | $3,429 | $258,400 | $74,100 | $184,300 |
| 2021 | $3,271 | $236,500 | $74,100 | $162,400 |
| 2020 | $3,297 | $236,500 | $74,100 | $162,400 |
| 2019 | $3,073 | $216,700 | $65,700 | $151,000 |
| 2018 | $2,548 | $203,700 | $65,700 | $138,000 |
| 2017 | $2,826 | $195,700 | $65,700 | $130,000 |
| 2016 | $2,752 | $189,400 | $65,700 | $123,700 |
| 2015 | $2,588 | $181,200 | $65,700 | $115,500 |
Source: Public Records
Map
Nearby Homes