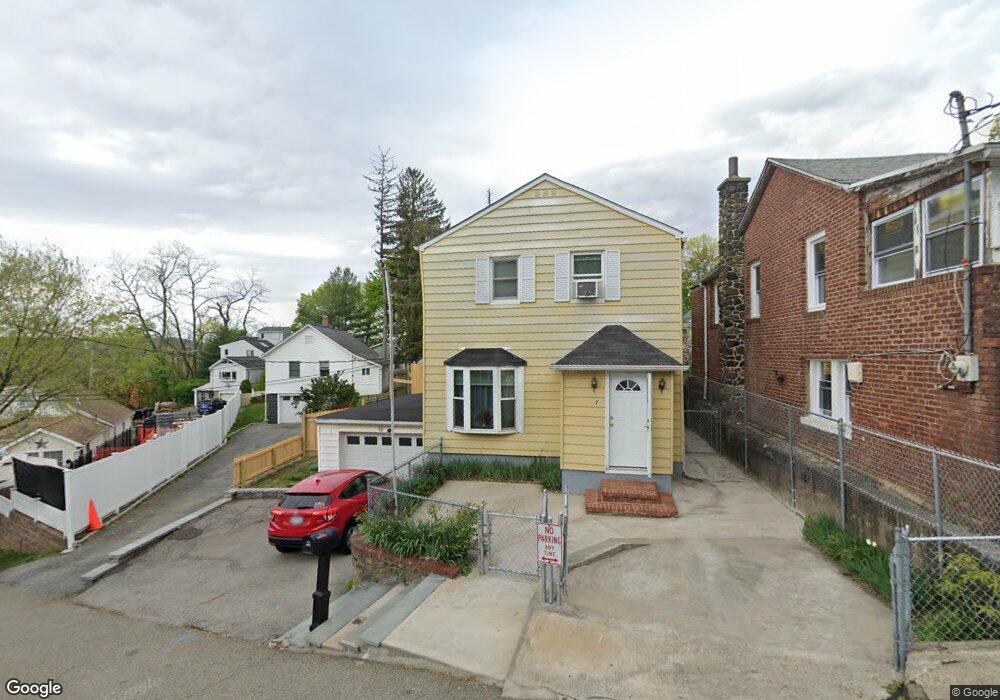
7 Hillcrest Ave Ossining, NY 10562
Estimated Value: $593,479 - $694,000
4
Beds
2
Baths
1,616
Sq Ft
$402/Sq Ft
Est. Value
About This Home
This home is located at 7 Hillcrest Ave, Ossining, NY 10562 and is currently estimated at $648,870, approximately $401 per square foot. 7 Hillcrest Ave is a home located in Westchester County with nearby schools including Park School, Claremont School, and Roosevelt Elementary School.
Ownership History
Date
Name
Owned For
Owner Type
Purchase Details
Closed on
Jan 3, 2023
Sold by
Monteiro Maria
Bought by
Cuyubamba Rosmery R Yaulimango and Aguirre Juan C
Current Estimated Value
Home Financials for this Owner
Home Financials are based on the most recent Mortgage that was taken out on this home.
Original Mortgage
$472,000
Outstanding Balance
$457,349
Interest Rate
6.58%
Mortgage Type
New Conventional
Estimated Equity
$191,521
Purchase Details
Closed on
Jan 30, 2022
Sold by
Montero Maria and Moneiro Afonso
Bought by
Yaulimango Cuyerbamba Rosmery R and Yaulimango Cori Aguirre
Home Financials for this Owner
Home Financials are based on the most recent Mortgage that was taken out on this home.
Original Mortgage
$472,000
Interest Rate
6.58%
Mortgage Type
New Conventional
Purchase Details
Closed on
Feb 3, 1995
Sold by
Walits Dorothy
Bought by
Cruz Boneida F
Create a Home Valuation Report for This Property
The Home Valuation Report is an in-depth analysis detailing your home's value as well as a comparison with similar homes in the area
Home Values in the Area
Average Home Value in this Area
Purchase History
| Date | Buyer | Sale Price | Title Company |
|---|---|---|---|
| Cuyubamba Rosmery R Yaulimango | $590,000 | Stewart Title | |
| Yaulimango Cuyerbamba Rosmery R | $590,000 | Title Agency Inc | |
| Cruz Boneida F | $165,000 | -- |
Source: Public Records
Mortgage History
| Date | Status | Borrower | Loan Amount |
|---|---|---|---|
| Open | Cuyubamba Rosmery R Yaulimango | $472,000 | |
| Previous Owner | Yaulimango Cuyerbamba Rosmery R | $472,000 |
Source: Public Records
Tax History
| Year | Tax Paid | Tax Assessment Tax Assessment Total Assessment is a certain percentage of the fair market value that is determined by local assessors to be the total taxable value of land and additions on the property. | Land | Improvement |
|---|---|---|---|---|
| 2024 | $15,542 | $513,600 | $115,900 | $397,700 |
| 2023 | $14,502 | $484,500 | $115,600 | $368,900 |
| 2022 | $8,762 | $414,900 | $115,600 | $299,300 |
| 2021 | $7,934 | $349,200 | $115,600 | $233,600 |
| 2020 | $7,235 | $324,500 | $115,600 | $208,900 |
| 2019 | $6,312 | $296,700 | $115,600 | $181,100 |
| 2018 | $9,187 | $290,900 | $115,600 | $175,300 |
| 2017 | $5,406 | $290,900 | $115,600 | $175,300 |
| 2016 | $96,327 | $290,900 | $115,600 | $175,300 |
| 2015 | -- | $12,100 | $2,600 | $9,500 |
| 2014 | -- | $12,100 | $2,600 | $9,500 |
| 2013 | -- | $12,100 | $2,600 | $9,500 |
Source: Public Records
Map
Nearby Homes
- 45 Old Albany Post Rd
- 9 Nicole Cir Unit 3
- 9 Briarcliff Dr S Unit 16
- 15 Steven Dr Unit 4
- 2 Briarcliff Dr S Unit 3
- 6 Briarcliff Dr S Unit 3
- 34 Piping Rock Dr
- 27 Hastings Ave
- 14 Glendale Rd
- 13 Reeback Dr
- 101 Eagle Bay Dr Unit 101
- 47 Stormytown Rd
- 8 Hudson Watch Dr
- 63 Cedar Ln
- 1204 Half Moon Bay Dr
- 113 Antler Ridge Unit 113
- 1708 Half Moon Bay Dr
- 64 Elmore Ave
- 76 Hawkes Ave
- 99 Quaker Bridge Rd
- 7 Hillcrest Ave
- 9 Hillcrest Ave
- 11 Hillcrest Ave
- 10 Samstag Ave
- 3 Hillcrest Ave
- 12 Samstag Ave
- 6 Samstag Ave
- 8 Hillcrest Ave
- 10 Hillcrest Ave
- 13 Hillcrest Ave
- 16 Samstag Ave
- 6 Hillcrest Ave
- 6 Hillcrest Ave
- 4 Hillcrest Ave
- 4 Hillcrest Ave
- 2 Hillcrest Ave
- 2 Hillcrest Ave
- 15 Hillcrest Ave
- 7 Samstag Ave
- 12 Hillcrest Ave
Your Personal Tour Guide
Ask me questions while you tour the home.