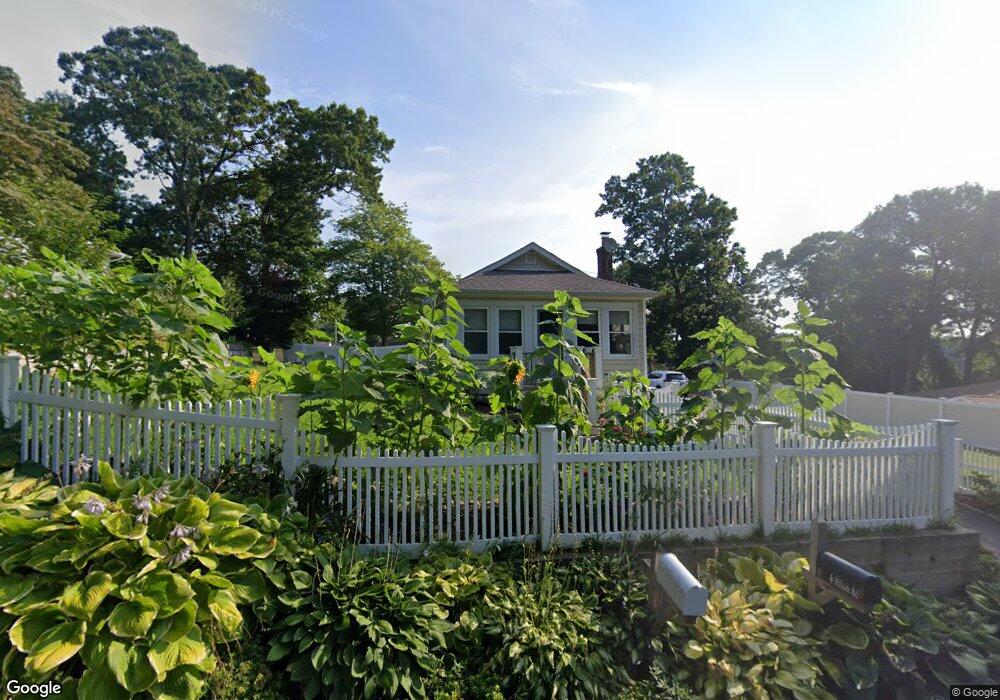
7 Hillside Rd Sound Beach, NY 11789
Estimated Value: $374,000 - $404,965
2
Beds
1
Bath
688
Sq Ft
$559/Sq Ft
Est. Value
About This Home
This home is located at 7 Hillside Rd, Sound Beach, NY 11789 and is currently estimated at $384,491, approximately $558 per square foot. 7 Hillside Rd is a home located in Suffolk County with nearby schools including Andrew Muller Primary School, Sound Beach School, and North Country Road School.
Ownership History
Date
Name
Owned For
Owner Type
Purchase Details
Closed on
Jun 16, 2017
Sold by
Zarella Michael A and Zarella Christina M
Bought by
Zaweski Jason and Murray Cynthia T
Current Estimated Value
Home Financials for this Owner
Home Financials are based on the most recent Mortgage that was taken out on this home.
Original Mortgage
$222,130
Outstanding Balance
$184,766
Interest Rate
4.02%
Mortgage Type
New Conventional
Estimated Equity
$199,725
Purchase Details
Closed on
Apr 24, 2007
Sold by
Criscito Robert J
Bought by
Zarella Michael A
Purchase Details
Closed on
Apr 21, 2004
Sold by
Johnson William M and Schibajew Jewgeniy
Bought by
Criscito Robert J
Home Financials for this Owner
Home Financials are based on the most recent Mortgage that was taken out on this home.
Original Mortgage
$206,000
Interest Rate
12%
Mortgage Type
Purchase Money Mortgage
Create a Home Valuation Report for This Property
The Home Valuation Report is an in-depth analysis detailing your home's value as well as a comparison with similar homes in the area
Home Values in the Area
Average Home Value in this Area
Purchase History
| Date | Buyer | Sale Price | Title Company |
|---|---|---|---|
| Zaweski Jason | $229,000 | None Available | |
| Zarella Michael A | $245,000 | Stephen G Remuzzi | |
| Criscito Robert J | $200,000 | Fidelity National Title Insu |
Source: Public Records
Mortgage History
| Date | Status | Borrower | Loan Amount |
|---|---|---|---|
| Open | Zaweski Jason | $222,130 | |
| Previous Owner | Criscito Robert J | $206,000 |
Source: Public Records
Tax History Compared to Growth
Tax History
| Year | Tax Paid | Tax Assessment Tax Assessment Total Assessment is a certain percentage of the fair market value that is determined by local assessors to be the total taxable value of land and additions on the property. | Land | Improvement |
|---|---|---|---|---|
| 2024 | $5,913 | $1,300 | $160 | $1,140 |
| 2023 | $5,913 | $1,300 | $160 | $1,140 |
| 2022 | $5,351 | $1,300 | $160 | $1,140 |
| 2021 | $5,351 | $1,300 | $160 | $1,140 |
| 2020 | $5,447 | $1,300 | $160 | $1,140 |
| 2019 | $5,447 | $0 | $0 | $0 |
| 2018 | -- | $1,300 | $160 | $1,140 |
| 2017 | $5,212 | $1,300 | $160 | $1,140 |
| 2016 | $5,224 | $1,300 | $160 | $1,140 |
| 2015 | -- | $1,300 | $160 | $1,140 |
| 2014 | -- | $1,300 | $160 | $1,140 |
Source: Public Records
Map
Nearby Homes
- 12 Hampton Rd
- 44 Lynbrook Dr
- 30 Long Beach Dr
- 207 Sound Beach Blvd
- 15 Woodhaven Dr
- 20 Whitestone Rd Unit 1486
- 5 Franklin Rd
- 14 Whitestone Rd
- 7 Rosedale Rd
- 48 Adams Ave
- 10 Queen Dr
- 59 Curtis Dr
- 129 Westbury Dr
- 260 Lower Rocky Point Rd
- 22 Lookout Dr
- 16 Deer Dr
- 41 Great River Dr
- 3 Beacon Dr
- 129 Shore Dr
- 11 Oceanside Dr
- 11 Hillside Rd
- 116 Valley Dr
- N/C Hillside Rd
- 6 Hillside Rd
- 6 Greenlawn Rd
- 1 Laurelton Rd
- 12 Hillside Rd
- 15 Hillside Rd
- 8 Greenlawn Rd
- 2 Greenlawn Rd
- 15 Laurelton Rd
- 10 Greenlawn Rd
- 17 Hillside Rd
- 9 Laurelton Rd
- 14 Greenlawn Rd
- 21 Hillside Rd
- 5 Greenlawn Rd
- 16 Westbury Dr
- 0 Hillside Rd Unit P1318485
- 7 Greenlawn Rd