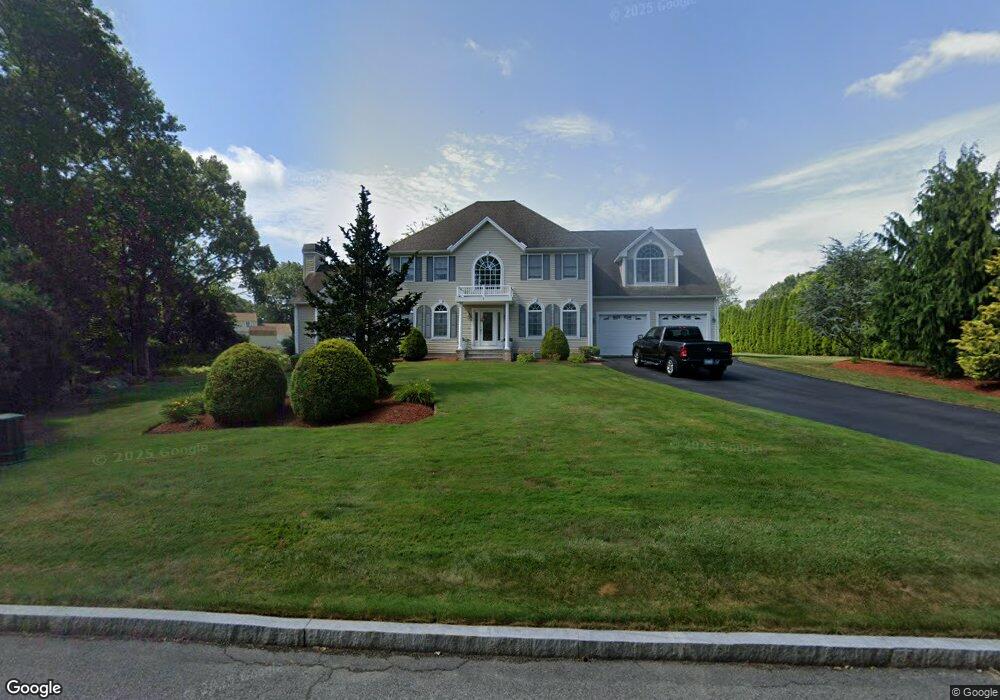
7 Hines Farm Dr Cumberland, RI 02864
Monastery Heights NeighborhoodEstimated Value: $862,176 - $1,157,000
4
Beds
3
Baths
3,204
Sq Ft
$310/Sq Ft
Est. Value
About This Home
This home is located at 7 Hines Farm Dr, Cumberland, RI 02864 and is currently estimated at $992,044, approximately $309 per square foot. 7 Hines Farm Dr is a home located in Providence County with nearby schools including Garvin Memorial School, Joseph L. McCourt Middle School, and Cumberland High School.
Ownership History
Date
Name
Owned For
Owner Type
Purchase Details
Closed on
Jun 29, 2018
Sold by
Martins Manuel V and Martins Maria F
Bought by
Martins Ft 2018
Current Estimated Value
Purchase Details
Closed on
Sep 3, 2002
Sold by
Marsh David A
Bought by
Martins Manuel V
Create a Home Valuation Report for This Property
The Home Valuation Report is an in-depth analysis detailing your home's value as well as a comparison with similar homes in the area
Home Values in the Area
Average Home Value in this Area
Purchase History
| Date | Buyer | Sale Price | Title Company |
|---|---|---|---|
| Martins Ft 2018 | -- | -- | |
| Martins Manuel V | $510,000 | -- |
Source: Public Records
Mortgage History
| Date | Status | Borrower | Loan Amount |
|---|---|---|---|
| Previous Owner | Martins Manuel V | $200,000 | |
| Previous Owner | Martins Manuel V | $294,000 | |
| Previous Owner | Martins Manuel V | $329,000 |
Source: Public Records
Tax History Compared to Growth
Tax History
| Year | Tax Paid | Tax Assessment Tax Assessment Total Assessment is a certain percentage of the fair market value that is determined by local assessors to be the total taxable value of land and additions on the property. | Land | Improvement |
|---|---|---|---|---|
| 2025 | $9,152 | $745,900 | $183,400 | $562,500 |
| 2024 | $8,914 | $745,900 | $183,400 | $562,500 |
| 2023 | $8,667 | $745,900 | $183,400 | $562,500 |
| 2022 | $8,571 | $571,800 | $127,400 | $444,400 |
| 2021 | $8,428 | $571,800 | $127,400 | $444,400 |
| 2020 | $8,188 | $571,800 | $127,400 | $444,400 |
| 2019 | $8,405 | $529,300 | $122,000 | $407,300 |
| 2018 | $1,051 | $529,300 | $122,000 | $407,300 |
| 2017 | $8,051 | $529,300 | $122,000 | $407,300 |
| 2016 | $8,391 | $491,300 | $130,500 | $360,800 |
| 2015 | $8,391 | $491,300 | $130,500 | $360,800 |
| 2014 | $8,391 | $491,300 | $130,500 | $360,800 |
| 2013 | $7,486 | $474,400 | $130,500 | $343,900 |
Source: Public Records
Map
Nearby Homes