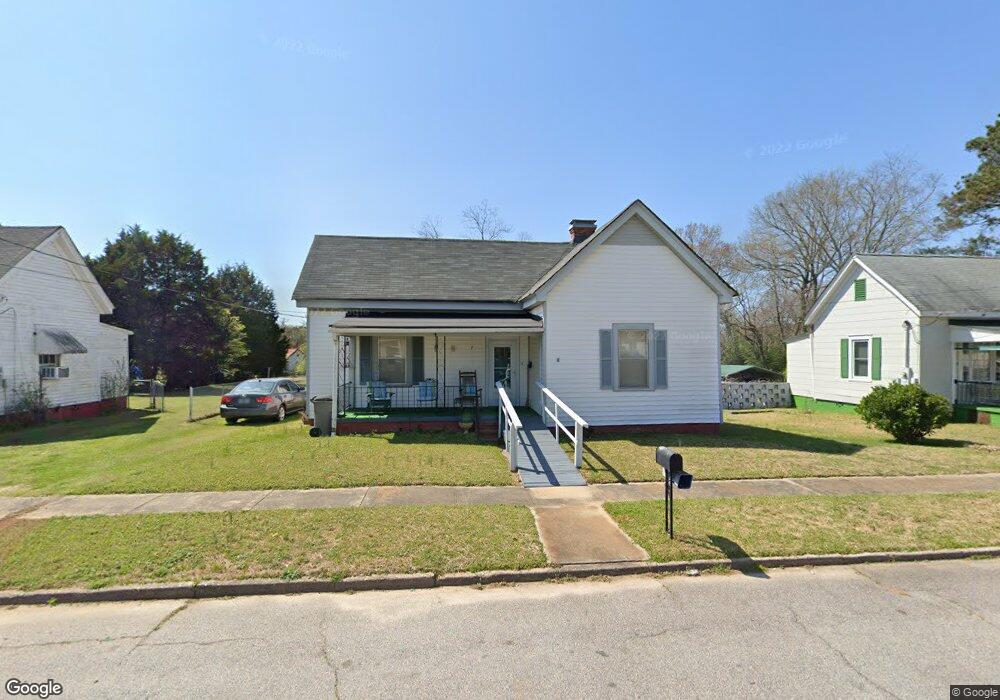
7 Hood St Lagrange, GA 30241
Estimated Value: $111,000 - $120,979
2
Beds
1
Bath
1,262
Sq Ft
$92/Sq Ft
Est. Value
About This Home
This home is located at 7 Hood St, Lagrange, GA 30241 and is currently estimated at $115,995, approximately $91 per square foot. 7 Hood St is a home located in Troup County with nearby schools including Franklin Forest Elementary School, Hollis Hand Elementary School, and Ethel W. Kight Elementary School.
Ownership History
Date
Name
Owned For
Owner Type
Purchase Details
Closed on
Jan 23, 2024
Sold by
Foster Margaret Lafaye
Bought by
Rindfleisch Connie Lynn and Foster Billy Ray
Current Estimated Value
Purchase Details
Closed on
Apr 27, 2007
Sold by
Smallwood Elsie Marie
Bought by
Foster Willie Harvey
Home Financials for this Owner
Home Financials are based on the most recent Mortgage that was taken out on this home.
Original Mortgage
$60,000
Interest Rate
6.11%
Mortgage Type
New Conventional
Purchase Details
Closed on
Mar 19, 2007
Sold by
Hutto Cecil Ray
Bought by
Matthews Jimmy
Home Financials for this Owner
Home Financials are based on the most recent Mortgage that was taken out on this home.
Original Mortgage
$60,000
Interest Rate
6.11%
Mortgage Type
New Conventional
Purchase Details
Closed on
Apr 22, 2005
Sold by
Bice Cecil Leldon
Bought by
Smallwood Richard A
Purchase Details
Closed on
Jan 1, 1964
Sold by
Dunson Mills
Bought by
Cecil Bice
Create a Home Valuation Report for This Property
The Home Valuation Report is an in-depth analysis detailing your home's value as well as a comparison with similar homes in the area
Purchase History
| Date | Buyer | Sale Price | Title Company |
|---|---|---|---|
| Rindfleisch Connie Lynn | -- | -- | |
| Foster Willie Harvey | $60,000 | -- | |
| Matthews Jimmy | $8,900 | -- | |
| Smallwood Richard A | $10,000 | -- | |
| Bice Cecil Leldon | -- | -- | |
| Cecil Bice | -- | -- |
Source: Public Records
Mortgage History
| Date | Status | Borrower | Loan Amount |
|---|---|---|---|
| Previous Owner | Foster Willie Harvey | $60,000 |
Source: Public Records
Tax History
| Year | Tax Paid | Tax Assessment Tax Assessment Total Assessment is a certain percentage of the fair market value that is determined by local assessors to be the total taxable value of land and additions on the property. | Land | Improvement |
|---|---|---|---|---|
| 2025 | $276 | $33,800 | $5,040 | $28,760 |
| 2024 | $865 | $31,720 | $5,040 | $26,680 |
| 2023 | $162 | $26,280 | $5,040 | $21,240 |
| 2022 | $161 | $25,160 | $5,040 | $20,120 |
| 2021 | $157 | $23,800 | $4,200 | $19,600 |
| 2020 | $417 | $23,800 | $4,200 | $19,600 |
| 2019 | $390 | $22,880 | $4,200 | $18,680 |
| 2018 | $397 | $23,130 | $3,450 | $19,680 |
| 2017 | $397 | $23,130 | $3,450 | $19,680 |
| 2016 | $377 | $22,442 | $3,450 | $18,992 |
| 2015 | $400 | $23,202 | $4,210 | $18,992 |
| 2014 | $370 | $22,203 | $4,210 | $17,992 |
| 2013 | -- | $23,284 | $4,072 | $19,212 |
Source: Public Records
Map
Nearby Homes
- 5 Curran Ave
- 4 1/2 Barnard Ave
- 87 Youngs Mill Rd
- 15 Fulton St
- 2 Louise St
- 204 Cleveland Dr
- 212 Cleveland Dr
- 0 E Render St
- 121 de Groat St
- 224 Rutland Cir
- 115 Clara Jean Ct
- 616 S Harlem Cir
- 203 Bonaventure Dr
- 0 N Barnard Ave
- 110 Lenox Cir
- 131 Foch St
- 107 N Barnard Ave
- 228 E Render St
- 3 Gulfstream Dr
- 706 N Harlem Cir
Your Personal Tour Guide
Ask me questions while you tour the home.