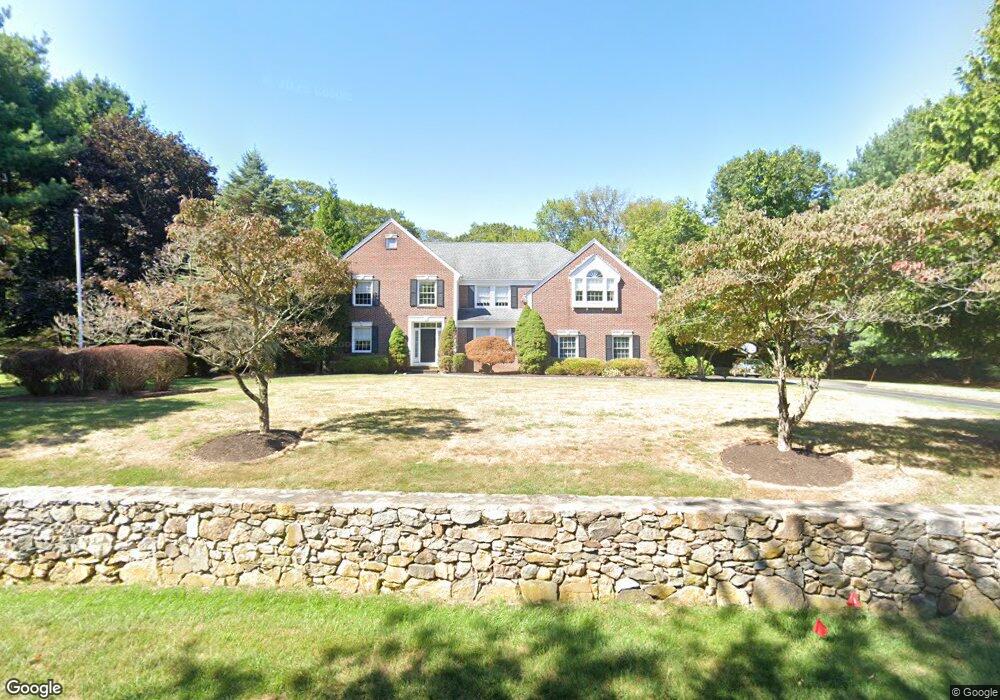
7 Howland Farm Rd East Greenwich, RI 02818
Nichols Corner NeighborhoodEstimated Value: $1,257,000 - $1,553,000
4
Beds
4
Baths
5,124
Sq Ft
$283/Sq Ft
Est. Value
About This Home
This home is located at 7 Howland Farm Rd, East Greenwich, RI 02818 and is currently estimated at $1,449,566, approximately $282 per square foot. 7 Howland Farm Rd is a home located in Kent County with nearby schools including Meadowbrook Farms Elementary School, James H. Eldredge Elementary School, and George Hanaford School.
Ownership History
Date
Name
Owned For
Owner Type
Purchase Details
Closed on
Oct 20, 2003
Sold by
White Michelle B
Bought by
Cheng David
Current Estimated Value
Home Financials for this Owner
Home Financials are based on the most recent Mortgage that was taken out on this home.
Original Mortgage
$470,000
Interest Rate
6.43%
Create a Home Valuation Report for This Property
The Home Valuation Report is an in-depth analysis detailing your home's value as well as a comparison with similar homes in the area
Home Values in the Area
Average Home Value in this Area
Purchase History
| Date | Buyer | Sale Price | Title Company |
|---|---|---|---|
| Cheng David | $820,000 | -- |
Source: Public Records
Mortgage History
| Date | Status | Borrower | Loan Amount |
|---|---|---|---|
| Open | Cheng David | $400,000 | |
| Closed | Cheng David | $470,000 |
Source: Public Records
Tax History Compared to Growth
Tax History
| Year | Tax Paid | Tax Assessment Tax Assessment Total Assessment is a certain percentage of the fair market value that is determined by local assessors to be the total taxable value of land and additions on the property. | Land | Improvement |
|---|---|---|---|---|
| 2025 | $18,833 | $1,209,600 | $381,500 | $828,100 |
| 2024 | $17,817 | $1,209,600 | $381,500 | $828,100 |
| 2023 | $17,506 | $801,200 | $276,500 | $524,700 |
| 2022 | $17,162 | $801,200 | $276,500 | $524,700 |
| 2021 | $16,833 | $801,200 | $276,500 | $524,700 |
| 2020 | $15,925 | $679,700 | $228,000 | $451,700 |
| 2019 | $15,776 | $679,700 | $228,000 | $451,700 |
| 2018 | $15,633 | $679,700 | $228,000 | $451,700 |
| 2017 | $15,154 | $640,500 | $217,700 | $422,800 |
| 2016 | $15,430 | $640,500 | $217,700 | $422,800 |
| 2015 | $14,898 | $640,500 | $217,700 | $422,800 |
| 2014 | $15,817 | $680,000 | $215,100 | $464,900 |
Source: Public Records
Map
Nearby Homes
- 584 Division St
- 181 Heritage Dr
- 44 Saddlebrook Dr
- 91 Cindyann Dr
- 199 1st Ave
- 185 Joseph Ct
- 20 Holly Hill Ct
- 127 Prospect St
- 154 Spring Valley Dr
- 109 Vistas Ct Unit 109
- 44 Stonebridge Ln Unit 38
- 67 Stonebridge Ln Unit 25
- 121 Hedgerow Dr
- 16 Shady Glen Dr
- 25 Deer Run Crossing Unit 45
- 66 Dagnillo Dr
- 58 Greene St
- 28 Hilltop Dr
- 9 Joseph N Zenga Jr Blvd Unit 201
- 9 Joseph N Zenga Jr Blvd Unit 109
- 8 Howland Farm Rd
- 5 Howland Farm Rd
- 6 Howland Farm Rd
- 3 Howland Farm Rd
- 80 Howland Rd
- 2 Howland Farm Rd
- 9 Howland Farm Rd
- 61 Howland Rd
- 4 Howland Farm Rd
- 10 Howland Farm Rd
- 1 Howland Farm Rd
- 741 Division St
- 634 Cedar Ave
- 0 Howland Farm Rd
- 11 Howland Farm Rd
- 776 Division Rd
- 3 Cedar Rock Meadows
- 12 Howland Farm Rd
- 709 Division St
- 709 Division Rd