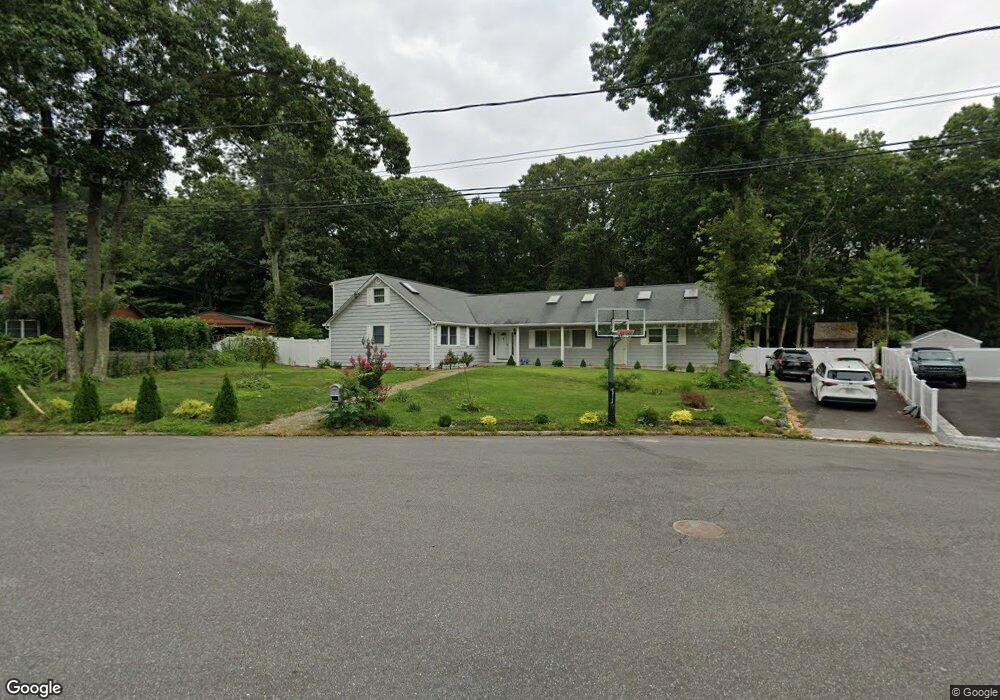
7 Hunters Ct East Setauket, NY 11733
Estimated Value: $577,000 - $954,000
6
Beds
3
Baths
2,640
Sq Ft
$301/Sq Ft
Est. Value
About This Home
This home is located at 7 Hunters Ct, East Setauket, NY 11733 and is currently estimated at $795,242, approximately $301 per square foot. 7 Hunters Ct is a home located in Suffolk County with nearby schools including Nassakeag Elementary School, Robert Cushman Murphy Junior High School, and Paul J Gelinas Junior High School.
Ownership History
Date
Name
Owned For
Owner Type
Purchase Details
Closed on
Feb 4, 2022
Sold by
Zheng Leonard and Yu Wenli
Bought by
Liu Hong P and Xing Zhipeng
Current Estimated Value
Home Financials for this Owner
Home Financials are based on the most recent Mortgage that was taken out on this home.
Original Mortgage
$444,500
Interest Rate
5.11%
Mortgage Type
Stand Alone Refi Refinance Of Original Loan
Purchase Details
Closed on
Aug 18, 2014
Sold by
Kraus Richard J and Kraus Genevieve M
Bought by
Gao Shang
Purchase Details
Closed on
Dec 14, 1999
Sold by
Valentine Joseph P and Valentine Joseph
Bought by
Kraus Richard J and Kraus Genevieve M
Home Financials for this Owner
Home Financials are based on the most recent Mortgage that was taken out on this home.
Original Mortgage
$160,000
Interest Rate
7.84%
Create a Home Valuation Report for This Property
The Home Valuation Report is an in-depth analysis detailing your home's value as well as a comparison with similar homes in the area
Home Values in the Area
Average Home Value in this Area
Purchase History
| Date | Buyer | Sale Price | Title Company |
|---|---|---|---|
| Liu Hong P | -- | None Available | |
| Liu Hong P | -- | None Available | |
| Gao Shang | $461,000 | -- | |
| Gao Shang | $461,000 | -- | |
| Kraus Richard J | $274,000 | Chicago Title Insurance Co | |
| Kraus Richard J | $274,000 | Chicago Title Insurance Co |
Source: Public Records
Mortgage History
| Date | Status | Borrower | Loan Amount |
|---|---|---|---|
| Previous Owner | Liu Hong P | $444,500 | |
| Previous Owner | Kraus Richard J | $160,000 |
Source: Public Records
Tax History Compared to Growth
Tax History
| Year | Tax Paid | Tax Assessment Tax Assessment Total Assessment is a certain percentage of the fair market value that is determined by local assessors to be the total taxable value of land and additions on the property. | Land | Improvement |
|---|---|---|---|---|
| 2024 | $15,276 | $3,525 | $450 | $3,075 |
| 2023 | $15,276 | $3,625 | $450 | $3,175 |
| 2022 | $12,754 | $3,625 | $450 | $3,175 |
| 2021 | $12,754 | $3,625 | $450 | $3,175 |
| 2020 | $13,171 | $3,625 | $450 | $3,175 |
| 2019 | $13,171 | $0 | $0 | $0 |
| 2018 | $12,496 | $3,625 | $450 | $3,175 |
| 2017 | $12,496 | $3,625 | $450 | $3,175 |
| 2016 | $12,319 | $3,625 | $450 | $3,175 |
| 2015 | -- | $3,625 | $450 | $3,175 |
| 2014 | -- | $3,625 | $450 | $3,175 |
Source: Public Records
Map
Nearby Homes
- 16 Sheppard Ln
- 16 Seabrook Ln
- 43 Seville Ln
- 4 Hargrove Dr
- 40 Oak Run Unit A Model
- 54 Aspen Ln
- 102 Sycamore Cir
- 16 Barnwell Ln
- 66 Barker Dr
- 15 Shadetree Ln
- 5 Bently Ln
- 39 Cornwallis Rd
- 5 Stratton Ct
- 39 Pembrook Dr
- 404 Oxhead Rd
- 11 Cobbler Ln
- 1472 Stony Brook Rd
- 457 Pond Path
- 1 University Heights Dr
- 30 Yorktown Rd