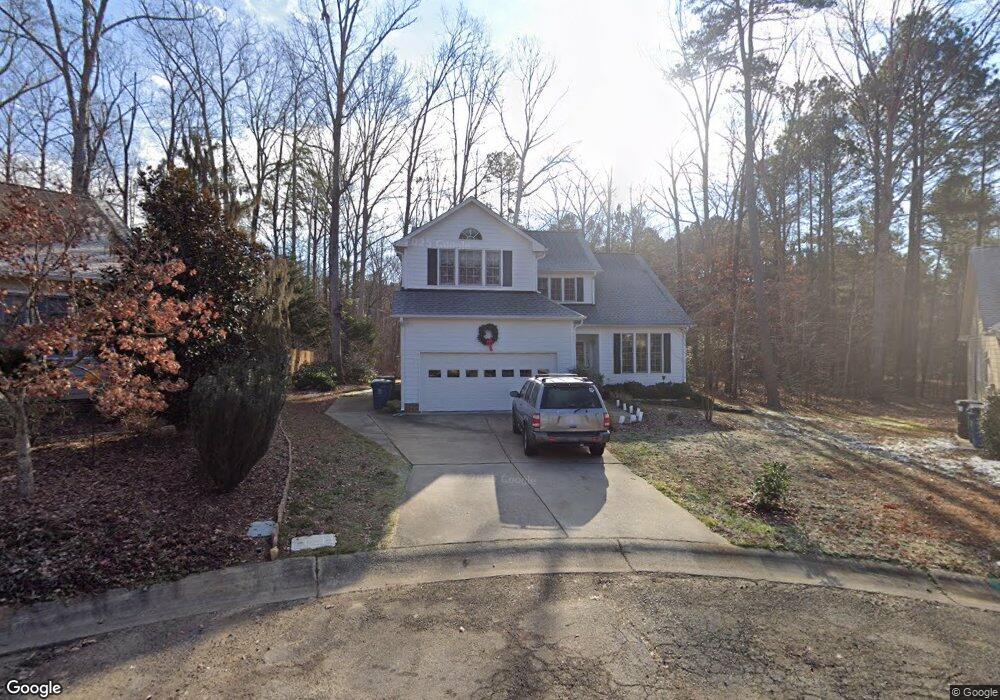
7 Huntscroft Ct Durham, NC 27713
Southpoint NeighborhoodEstimated Value: $616,294 - $656,000
4
Beds
3
Baths
2,306
Sq Ft
$274/Sq Ft
Est. Value
About This Home
This home is located at 7 Huntscroft Ct, Durham, NC 27713 and is currently estimated at $631,074, approximately $273 per square foot. 7 Huntscroft Ct is a home located in Durham County with nearby schools including Lowe's Grove Middle, Hillside High School, and Montessori Community School.
Ownership History
Date
Name
Owned For
Owner Type
Purchase Details
Closed on
Apr 22, 2016
Sold by
Mathis Ryan L
Bought by
Simpson Vos Mark D and Simpson Vos Juliellen
Current Estimated Value
Home Financials for this Owner
Home Financials are based on the most recent Mortgage that was taken out on this home.
Original Mortgage
$279,193
Outstanding Balance
$222,020
Interest Rate
3.71%
Estimated Equity
$409,054
Purchase Details
Closed on
Dec 14, 2007
Sold by
Snipes James A and Fuentes Snipes Lisbeth D
Bought by
Mathis Ryan L and Mathis Lindy Quinn
Home Financials for this Owner
Home Financials are based on the most recent Mortgage that was taken out on this home.
Original Mortgage
$230,000
Interest Rate
6.22%
Purchase Details
Closed on
Sep 30, 2002
Sold by
Kelly Construction Company Of Durham Inc
Bought by
Snipes James A and Fuentes Snipes Lisbeth D
Home Financials for this Owner
Home Financials are based on the most recent Mortgage that was taken out on this home.
Original Mortgage
$184,000
Interest Rate
6.27%
Create a Home Valuation Report for This Property
The Home Valuation Report is an in-depth analysis detailing your home's value as well as a comparison with similar homes in the area
Home Values in the Area
Average Home Value in this Area
Purchase History
| Date | Buyer | Sale Price | Title Company |
|---|---|---|---|
| Simpson Vos Mark D | $305,000 | -- | |
| Mathis Ryan L | $287,500 | None Available | |
| Snipes James A | $212,500 | -- |
Source: Public Records
Mortgage History
| Date | Status | Borrower | Loan Amount |
|---|---|---|---|
| Open | Simpson Vos Mark D | $279,193 | |
| Previous Owner | Mathis Ryan L | $230,000 | |
| Previous Owner | Mathis Ryan L | $28,745 | |
| Previous Owner | Snipes James A | $184,000 | |
| Closed | Snipes James A | $34,500 |
Source: Public Records
Tax History Compared to Growth
Tax History
| Year | Tax Paid | Tax Assessment Tax Assessment Total Assessment is a certain percentage of the fair market value that is determined by local assessors to be the total taxable value of land and additions on the property. | Land | Improvement |
|---|---|---|---|---|
| 2025 | $5,718 | $576,815 | $189,000 | $387,815 |
| 2024 | $4,535 | $325,139 | $78,937 | $246,202 |
| 2023 | $4,259 | $325,139 | $78,937 | $246,202 |
| 2022 | $4,161 | $325,139 | $78,937 | $246,202 |
| 2021 | $4,142 | $325,139 | $78,937 | $246,202 |
| 2020 | $4,044 | $325,139 | $78,937 | $246,202 |
| 2019 | $4,044 | $325,139 | $78,937 | $246,202 |
| 2018 | $3,819 | $281,562 | $44,205 | $237,357 |
| 2017 | $3,791 | $281,562 | $44,205 | $237,357 |
| 2016 | $3,663 | $281,562 | $44,205 | $237,357 |
| 2015 | $3,666 | $264,814 | $48,400 | $216,414 |
| 2014 | $3,666 | $264,814 | $48,400 | $216,414 |
Source: Public Records
Map
Nearby Homes
- 1612 Timber Wolf Dr
- 8017 Morrell Ln
- 8424 Eagle View Dr
- 1604 Timber Wolf Dr
- 8027 Sundance Cir
- 519 Hunting Chase
- 1118 Scholastic Cir
- 1215 Bellenden Dr
- 7502 Hedfield Way
- 1217 Great Egret Way
- 1416 Southpoint Trail
- 1040 Bellenden Dr
- 8115 Massey Chapel Rd
- 107 Alumni Ave
- 142 College Ave
- 7516 Massey Chapel Rd
- 316 Academia Ct
- 120 James Ross Drive Rd
- 233 S Bend Dr
- 211 Cool Spring Rd
- 5 Huntscroft Ct
- 8 Huntscroft Ct
- 3 Huntscroft Ct
- 6 Huntscroft Ct
- 8112 Crichton Ln
- 4 Huntscroft Ct
- 8114 Crichton Ln
- 1 Huntscroft Ct
- 8301 Buck Crossing Dr
- 8201 Buck Crossing Dr
- 8303 Buck Crossing Dr
- 8204 Buck Crossing Dr
- 8109 Crichton Ln
- 8202 Buck Crossing Dr
- 8300 Buck Crossing Dr
- 215 Norcross Rd
- 8302 Buck Crossing Dr
- 8309 Buck Crossing Dr
- 8105 Crichton Ln
- 8304 Buck Crossing Dr