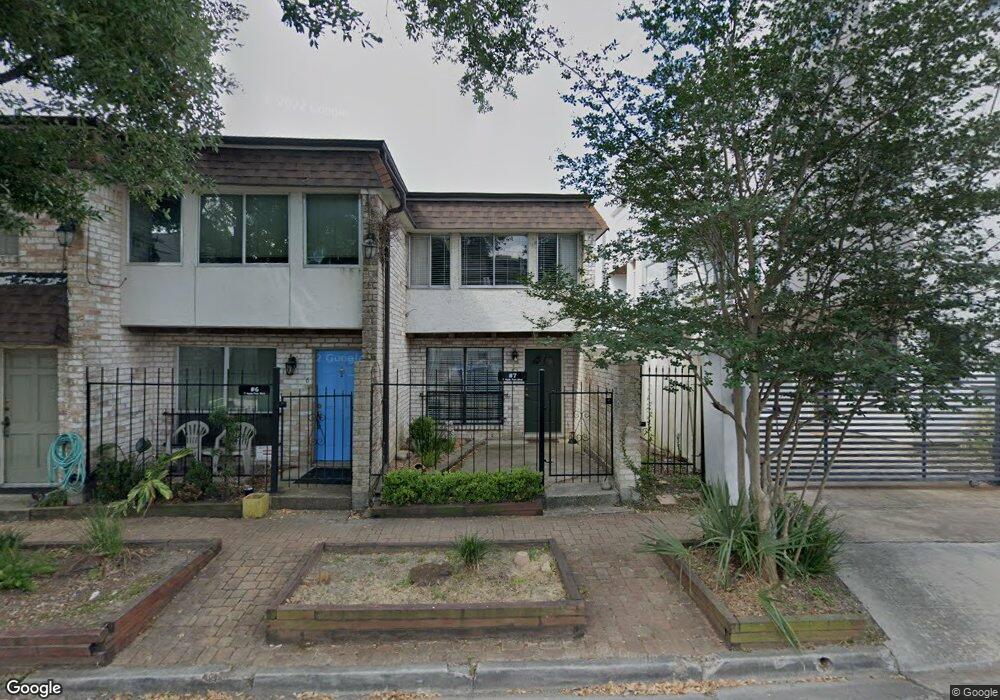
7 Hyde Park Blvd Unit 3 Houston, TX 77006
Montrose NeighborhoodEstimated Value: $218,255 - $346,000
2
Beds
2
Baths
1,068
Sq Ft
$261/Sq Ft
Est. Value
About This Home
This home is located at 7 Hyde Park Blvd Unit 3, Houston, TX 77006 and is currently estimated at $278,314, approximately $260 per square foot. 7 Hyde Park Blvd Unit 3 is a home located in Harris County with nearby schools including Gregory-Lincoln Ed Center, Wharton Dual Language Academy, and Lamar High School.
Ownership History
Date
Name
Owned For
Owner Type
Purchase Details
Closed on
May 1, 2012
Sold by
Tesone Jeffrey and Tesone Jennifer
Bought by
Clifton Pena Celina and Lara Cristina
Current Estimated Value
Home Financials for this Owner
Home Financials are based on the most recent Mortgage that was taken out on this home.
Original Mortgage
$96,587
Outstanding Balance
$68,008
Interest Rate
4.25%
Mortgage Type
FHA
Estimated Equity
$210,306
Purchase Details
Closed on
Jun 1, 2000
Sold by
Rea R San
Bought by
Mendiola Omar
Home Financials for this Owner
Home Financials are based on the most recent Mortgage that was taken out on this home.
Original Mortgage
$53,200
Interest Rate
8.3%
Purchase Details
Closed on
Feb 7, 2000
Sold by
Killough Norwood H and Killough Pauline M
Bought by
Molane Karen Elizabeth
Home Financials for this Owner
Home Financials are based on the most recent Mortgage that was taken out on this home.
Original Mortgage
$63,600
Interest Rate
3.95%
Create a Home Valuation Report for This Property
The Home Valuation Report is an in-depth analysis detailing your home's value as well as a comparison with similar homes in the area
Home Values in the Area
Average Home Value in this Area
Purchase History
| Date | Buyer | Sale Price | Title Company |
|---|---|---|---|
| Clifton Pena Celina | -- | None Available | |
| Mendiola Omar | -- | Regency Title | |
| Molane Karen Elizabeth | -- | Chicago Title |
Source: Public Records
Mortgage History
| Date | Status | Borrower | Loan Amount |
|---|---|---|---|
| Open | Clifton Pena Celina | $96,587 | |
| Previous Owner | Mendiola Omar | $53,200 | |
| Previous Owner | Molane Karen Elizabeth | $63,600 |
Source: Public Records
Tax History Compared to Growth
Tax History
| Year | Tax Paid | Tax Assessment Tax Assessment Total Assessment is a certain percentage of the fair market value that is determined by local assessors to be the total taxable value of land and additions on the property. | Land | Improvement |
|---|---|---|---|---|
| 2025 | $3,253 | $224,971 | $82,000 | $142,971 |
| 2024 | $3,253 | $216,169 | $72,160 | $144,009 |
| 2023 | $3,253 | $216,169 | $72,160 | $144,009 |
| 2022 | $3,561 | $161,705 | $55,760 | $105,945 |
| 2021 | $3,868 | $165,953 | $55,760 | $110,193 |
| 2020 | $4,019 | $165,953 | $55,760 | $110,193 |
| 2019 | $4,039 | $165,953 | $55,760 | $110,193 |
| 2018 | $3,161 | $171,560 | $55,760 | $115,800 |
| 2017 | $3,500 | $171,560 | $55,760 | $115,800 |
| 2016 | $3,182 | $171,560 | $55,760 | $115,800 |
| 2015 | $2,208 | $177,997 | $49,200 | $128,797 |
| 2014 | $2,208 | $99,100 | $26,240 | $72,860 |
Source: Public Records
Map
Nearby Homes
- 12 Hyde Park Blvd Unit 7
- 12 Hyde Park Blvd Unit 5
- 211 Stratford St
- 2703 Mason St Unit 16
- 2703 Mason St Unit 13
- 215 Avondale St
- 98 Drew St Unit B
- 309 Stratford St Unit 18
- 234 Westheimer Rd Unit 8
- 2716 Baldwin St
- 2624 Helena St
- 201 Westheimer Rd Unit E
- 402 Tuam St Unit 2
- 402 Tuam St Unit 7
- 403 Anita St Unit 10
- 415 Tuam St
- 2223 Taft St
- 239 Westheimer Rd Unit 1
- 308 Dennis St
- 209 W Drew St
- 7 Hyde Park Blvd Unit 4
- 7 Hyde Park Blvd Unit 7
- 7 Hyde Park Blvd Unit 6
- 7 Hyde Park Blvd Unit 5
- 7 Hyde Park Blvd Unit 2
- 7 Hyde Park Blvd
- 2924 Helena St Unit 1
- 11 Hyde Park Blvd
- 11 Hyde Park Blvd
- 11 Hyde Park Blvd
- 11 Hyde Park Blvd Unit A
- 11 Hyde Park Blvd Unit C
- 15 Hyde Park Blvd
- 203 Stratford St
- 203 Stratford St Unit 3
- 203 Stratford St Unit 4
- 205 Stratford St
- 2926 Helena St
- 2926 Helena St Unit B
- 2926 Helena St Unit A