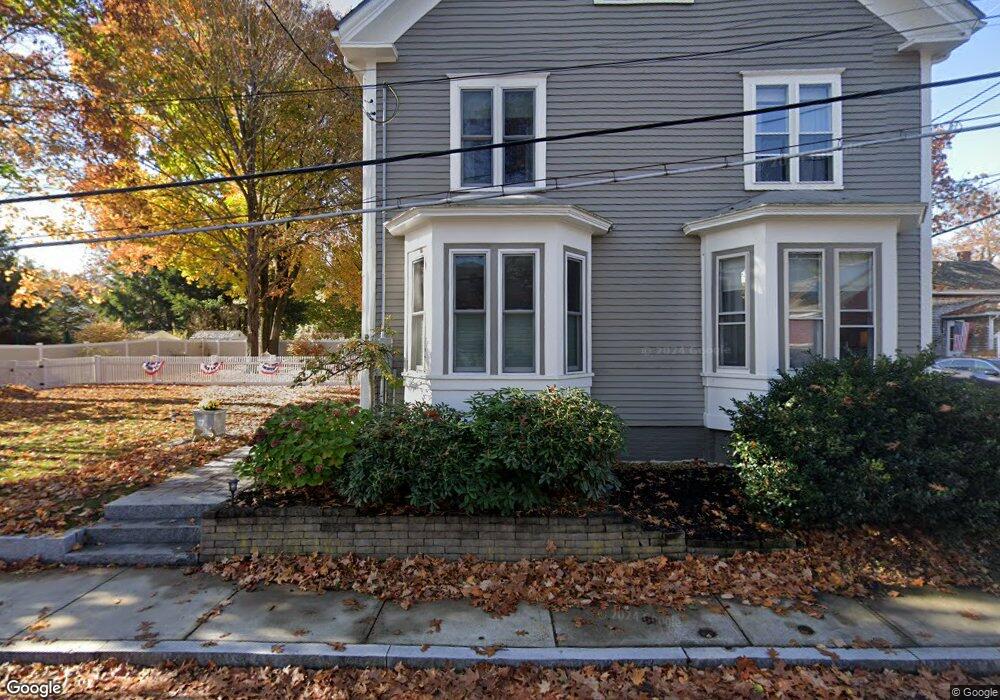
7 Jackson St Newburyport, MA 01950
Estimated Value: $791,729 - $966,000
3
Beds
1
Bath
1,600
Sq Ft
$544/Sq Ft
Est. Value
About This Home
This home is located at 7 Jackson St, Newburyport, MA 01950 and is currently estimated at $870,576, approximately $544 per square foot. 7 Jackson St is a home located in Essex County with nearby schools including Francis T. Bresnahan Elementary School, Edward G. Molin Elementary School, and Rupert A. Nock Middle School.
Ownership History
Date
Name
Owned For
Owner Type
Purchase Details
Closed on
May 9, 2013
Sold by
Connolly C C Est
Bought by
Dilorenzo Susan J and Picariello Pamela
Current Estimated Value
Home Financials for this Owner
Home Financials are based on the most recent Mortgage that was taken out on this home.
Original Mortgage
$401,500
Outstanding Balance
$286,034
Interest Rate
3.6%
Mortgage Type
New Conventional
Estimated Equity
$584,542
Purchase Details
Closed on
Nov 18, 2011
Sold by
Morey Michelle L
Bought by
Messina Kathryn and Connolly Christopher
Home Financials for this Owner
Home Financials are based on the most recent Mortgage that was taken out on this home.
Original Mortgage
$332,500
Interest Rate
3.92%
Mortgage Type
Purchase Money Mortgage
Purchase Details
Closed on
Jun 29, 2007
Sold by
Fhlmc
Bought by
Morey Michelle L
Home Financials for this Owner
Home Financials are based on the most recent Mortgage that was taken out on this home.
Original Mortgage
$243,675
Interest Rate
6.24%
Mortgage Type
Purchase Money Mortgage
Purchase Details
Closed on
May 23, 2007
Sold by
Putur Marianne H and Wells Fargo Bk
Bought by
Fhlmc
Home Financials for this Owner
Home Financials are based on the most recent Mortgage that was taken out on this home.
Original Mortgage
$243,675
Interest Rate
6.24%
Mortgage Type
Purchase Money Mortgage
Purchase Details
Closed on
Mar 16, 2006
Sold by
Bodell Cindy P
Bought by
Putur Marianne H
Purchase Details
Closed on
Apr 1, 1988
Sold by
Irujo Javier M
Bought by
Olsen Thomas C
Create a Home Valuation Report for This Property
The Home Valuation Report is an in-depth analysis detailing your home's value as well as a comparison with similar homes in the area
Home Values in the Area
Average Home Value in this Area
Purchase History
| Date | Buyer | Sale Price | Title Company |
|---|---|---|---|
| Dilorenzo Susan J | $435,000 | -- | |
| Messina Kathryn | $350,000 | -- | |
| Morey Michelle L | $324,900 | -- | |
| Fhlmc | $310,690 | -- | |
| Putur Marianne H | $367,500 | -- | |
| Olsen Thomas C | $120,000 | -- |
Source: Public Records
Mortgage History
| Date | Status | Borrower | Loan Amount |
|---|---|---|---|
| Open | Dilorenzo Susan J | $401,500 | |
| Previous Owner | Olsen Thomas C | $332,500 | |
| Previous Owner | Olsen Thomas C | $243,675 |
Source: Public Records
Tax History Compared to Growth
Tax History
| Year | Tax Paid | Tax Assessment Tax Assessment Total Assessment is a certain percentage of the fair market value that is determined by local assessors to be the total taxable value of land and additions on the property. | Land | Improvement |
|---|---|---|---|---|
| 2025 | $6,635 | $692,600 | $382,800 | $309,800 |
| 2024 | $6,341 | $636,000 | $348,000 | $288,000 |
| 2023 | $6,167 | $574,200 | $302,600 | $271,600 |
| 2022 | $5,712 | $475,600 | $252,100 | $223,500 |
| 2021 | $5,399 | $427,100 | $229,200 | $197,900 |
| 2020 | $5,263 | $409,900 | $229,200 | $180,700 |
| 2019 | $5,361 | $409,900 | $229,200 | $180,700 |
| 2018 | $5,148 | $388,200 | $218,300 | $169,900 |
| 2017 | $5,009 | $372,400 | $207,900 | $164,500 |
| 2016 | $4,858 | $362,800 | $198,100 | $164,700 |
| 2015 | $4,840 | $362,800 | $198,100 | $164,700 |
Source: Public Records
Map
Nearby Homes
- 288 Merrimac St
- 13 Broad St
- 217 Merrimac St Unit 1
- 266 Merrimac St Unit F
- 27 Warren St Unit 1
- 287 1/2 High St
- 158 Merrimac St Unit 3
- 126 Merrimac St Unit 35
- 126 Merrimac St Unit 31
- 45 Boardman St Unit 1
- 41 Washington St Unit B
- 44 Washington St Unit C
- 14 Dexter Ln Unit B
- 14 Dexter Ln Unit A
- 138 Low St
- 110 Low St
- 19 Jefferson St
- 1 Jefferson St
- 58 Merrimac St Unit 2-5
- 42 Myrtle Ave