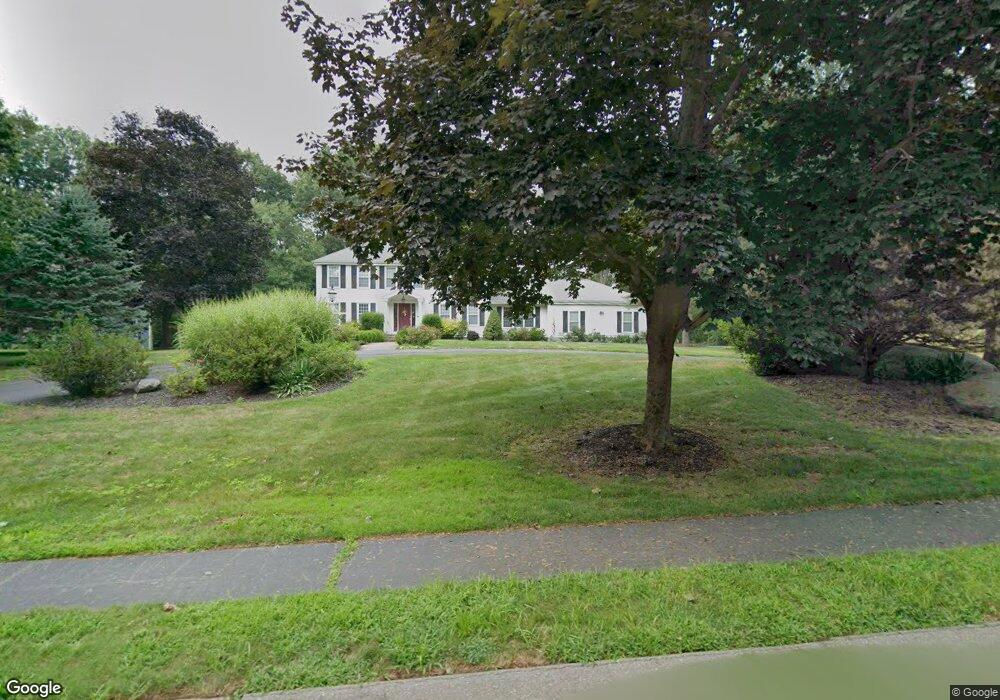
7 Jacob Dr Mansfield, MA 02048
Estimated Value: $996,349 - $1,340,000
4
Beds
3
Baths
3,082
Sq Ft
$364/Sq Ft
Est. Value
About This Home
This home is located at 7 Jacob Dr, Mansfield, MA 02048 and is currently estimated at $1,120,337, approximately $363 per square foot. 7 Jacob Dr is a home located in Bristol County with nearby schools including Everett W. Robinson Elementary School, Jordan/Jackson Elementary School, and Harold L. Qualters Middle School.
Ownership History
Date
Name
Owned For
Owner Type
Purchase Details
Closed on
Nov 30, 2007
Sold by
Chotkowski Paul C and Chotkowski Frances J
Bought by
Joanne Charles Rt
Current Estimated Value
Purchase Details
Closed on
Sep 15, 2000
Sold by
Macdonald Robert G and Macdonald Mary C
Bought by
Chotkowski Paul C and Chotkowski Frances J
Home Financials for this Owner
Home Financials are based on the most recent Mortgage that was taken out on this home.
Original Mortgage
$100,000
Interest Rate
8.07%
Mortgage Type
Purchase Money Mortgage
Create a Home Valuation Report for This Property
The Home Valuation Report is an in-depth analysis detailing your home's value as well as a comparison with similar homes in the area
Home Values in the Area
Average Home Value in this Area
Purchase History
| Date | Buyer | Sale Price | Title Company |
|---|---|---|---|
| Joanne Charles Rt | -- | -- | |
| Chotkowski Paul C | $445,000 | -- |
Source: Public Records
Mortgage History
| Date | Status | Borrower | Loan Amount |
|---|---|---|---|
| Previous Owner | Chotkowski Paul C | $150,000 | |
| Previous Owner | Chotkowski Paul C | $99,000 | |
| Previous Owner | Chotkowski Paul C | $100,000 | |
| Previous Owner | Chotkowski Paul C | $65,000 |
Source: Public Records
Tax History
| Year | Tax Paid | Tax Assessment Tax Assessment Total Assessment is a certain percentage of the fair market value that is determined by local assessors to be the total taxable value of land and additions on the property. | Land | Improvement |
|---|---|---|---|---|
| 2025 | $11,844 | $899,300 | $266,100 | $633,200 |
| 2024 | $11,696 | $866,400 | $278,200 | $588,200 |
| 2023 | $11,154 | $791,600 | $278,200 | $513,400 |
| 2022 | $10,654 | $702,300 | $257,400 | $444,900 |
| 2021 | $3,738 | $717,600 | $242,700 | $474,900 |
| 2020 | $3,949 | $704,900 | $242,700 | $462,200 |
| 2019 | $10,531 | $691,900 | $225,400 | $466,500 |
| 2018 | $4,134 | $673,100 | $215,000 | $458,100 |
| 2017 | $9,828 | $654,300 | $208,900 | $445,400 |
| 2016 | $9,873 | $640,700 | $229,000 | $411,700 |
| 2015 | $9,605 | $619,700 | $229,000 | $390,700 |
Source: Public Records
Map
Nearby Homes
- 128 Tremont St
- 17 Childs Ln
- 24 Maverick Dr
- 1769 West St
- 25 Shepherd St
- 401 South St
- 14 Claire Ave
- 150 Gilbert St
- 346 South St
- 40 Treasure Island Rd
- 16 Treasure Island Rd
- 9 Coach Rd
- 84 Messenger St
- 33 Colonial Way
- 25 Munroe Dr
- 166 Chauncy St
- 46 Mirimichi St
- 356 Central St
- 38 Mirimichi St
- 150 Rumford Ave Unit 110
Your Personal Tour Guide
Ask me questions while you tour the home.