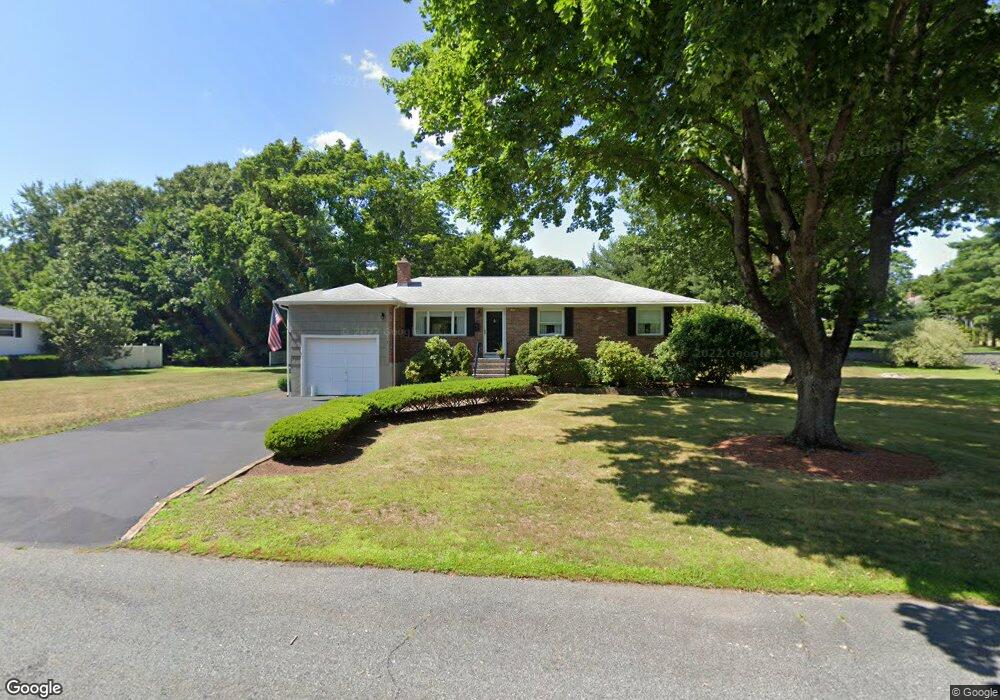
7 Janice Cir Framingham, MA 01701
Nobscot NeighborhoodEstimated Value: $659,703 - $704,000
3
Beds
2
Baths
1,508
Sq Ft
$457/Sq Ft
Est. Value
About This Home
This home is located at 7 Janice Cir, Framingham, MA 01701 and is currently estimated at $689,176, approximately $457 per square foot. 7 Janice Cir is a home located in Middlesex County with nearby schools including Framingham High School, MetroWest Jewish Day School, and Summit Montessori School.
Ownership History
Date
Name
Owned For
Owner Type
Purchase Details
Closed on
Jan 26, 2023
Sold by
Brown Russell P and Brown Janice
Bought by
Brown Janice
Current Estimated Value
Purchase Details
Closed on
Mar 16, 1971
Bought by
Brown Russell P and Brown Janice
Create a Home Valuation Report for This Property
The Home Valuation Report is an in-depth analysis detailing your home's value as well as a comparison with similar homes in the area
Home Values in the Area
Average Home Value in this Area
Purchase History
| Date | Buyer | Sale Price | Title Company |
|---|---|---|---|
| Brown Janice | -- | None Available | |
| Brown Janice | -- | None Available | |
| Brown Russell P | -- | -- |
Source: Public Records
Mortgage History
| Date | Status | Borrower | Loan Amount |
|---|---|---|---|
| Previous Owner | Brown Russell P | $200,000 | |
| Previous Owner | Brown Russell P | $150,000 | |
| Previous Owner | Brown Russell P | $50,000 | |
| Previous Owner | Brown Russell P | $15,000 |
Source: Public Records
Tax History
| Year | Tax Paid | Tax Assessment Tax Assessment Total Assessment is a certain percentage of the fair market value that is determined by local assessors to be the total taxable value of land and additions on the property. | Land | Improvement |
|---|---|---|---|---|
| 2025 | $7,340 | $614,700 | $271,400 | $343,300 |
| 2024 | $7,137 | $572,800 | $242,400 | $330,400 |
| 2023 | $6,745 | $515,300 | $216,400 | $298,900 |
| 2022 | $6,410 | $466,500 | $196,400 | $270,100 |
| 2021 | $6,213 | $442,200 | $188,700 | $253,500 |
| 2020 | $6,068 | $405,100 | $171,500 | $233,600 |
| 2019 | $5,951 | $386,900 | $171,500 | $215,400 |
| 2018 | $5,859 | $359,000 | $165,100 | $193,900 |
| 2017 | $5,752 | $344,200 | $160,300 | $183,900 |
| 2016 | $5,574 | $320,700 | $160,300 | $160,400 |
| 2015 | $5,321 | $298,600 | $160,800 | $137,800 |
Source: Public Records
Map
Nearby Homes
- 32 Lyman Rd
- 484 Edgell Rd
- 44 Agnes Dr
- 472 Brook St
- 51 Woodland Dr
- 5 Lavelle Ln
- 2 Hemenway Rd
- 16 Bayberry Ln
- 401 Belknap Rd
- 11 Bellwood Way
- 2 Grove St
- 1060 Grove St Unit 31
- 1060 Grove St Unit 23
- 1060 Grove St Unit 43
- 1060 Grove St Unit 24
- 15 Woodmere Rd
- 356 Central St
- 10 Rolling Ln
- 231 Central St
- 620 Edmands Rd
Your Personal Tour Guide
Ask me questions while you tour the home.