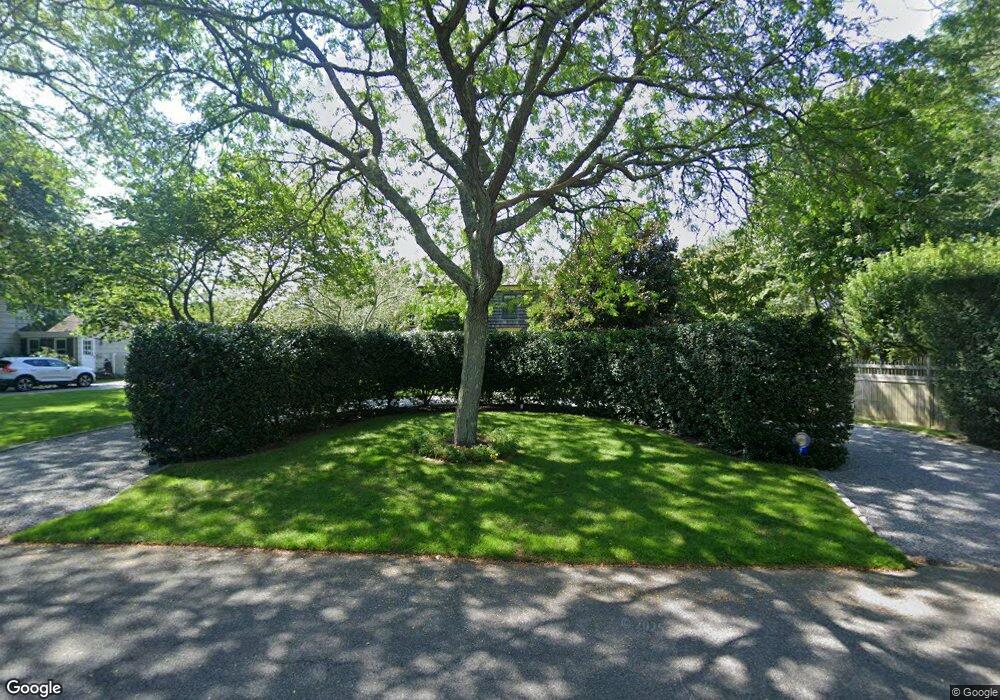
7 Johnny Ln Southampton, NY 11968
Estimated Value: $3,242,833 - $5,403,000
4
Beds
2
Baths
1,803
Sq Ft
$2,154/Sq Ft
Est. Value
About This Home
This home is located at 7 Johnny Ln, Southampton, NY 11968 and is currently estimated at $3,884,458, approximately $2,154 per square foot. 7 Johnny Ln is a home located in Suffolk County with nearby schools including Southampton Elementary School, Southampton Intermediate School, and Southampton High School.
Ownership History
Date
Name
Owned For
Owner Type
Purchase Details
Closed on
Jul 26, 1999
Sold by
Maurice B Cunningham Inc
Bought by
Blanton William W
Current Estimated Value
Purchase Details
Closed on
May 4, 1999
Sold by
Olds John Quinn and Polar Joseph W
Bought by
Schweon Jordan and Genzlinger Catherine
Home Financials for this Owner
Home Financials are based on the most recent Mortgage that was taken out on this home.
Original Mortgage
$400,000
Interest Rate
6.5%
Purchase Details
Closed on
Aug 22, 1997
Sold by
Blanton William
Bought by
Olds John Quinn and Polar Joseph W
Create a Home Valuation Report for This Property
The Home Valuation Report is an in-depth analysis detailing your home's value as well as a comparison with similar homes in the area
Home Values in the Area
Average Home Value in this Area
Purchase History
| Date | Buyer | Sale Price | Title Company |
|---|---|---|---|
| Blanton William W | -- | First American Title Ins Co | |
| Schweon Jordan | $535,000 | Classic Abstract Ltd | |
| Olds John Quinn | $372,500 | First American Title Ins Co |
Source: Public Records
Mortgage History
| Date | Status | Borrower | Loan Amount |
|---|---|---|---|
| Previous Owner | Schweon Jordan | $400,000 |
Source: Public Records
Tax History Compared to Growth
Tax History
| Year | Tax Paid | Tax Assessment Tax Assessment Total Assessment is a certain percentage of the fair market value that is determined by local assessors to be the total taxable value of land and additions on the property. | Land | Improvement |
|---|---|---|---|---|
| 2024 | $2,050 | $2,082,700 | $1,710,000 | $372,700 |
| 2023 | $2,050 | $2,082,700 | $1,710,000 | $372,700 |
| 2022 | $5,014 | $2,082,700 | $1,710,000 | $372,700 |
| 2021 | $5,014 | $2,082,700 | $1,710,000 | $372,700 |
| 2020 | $7,622 | $2,052,300 | $1,710,000 | $342,300 |
| 2019 | $7,557 | $0 | $0 | $0 |
| 2018 | -- | $2,019,600 | $1,710,000 | $309,600 |
| 2017 | $6,101 | $2,019,600 | $1,710,000 | $309,600 |
| 2016 | $5,684 | $1,802,400 | $1,492,800 | $309,600 |
| 2015 | -- | $1,531,000 | $1,221,400 | $309,600 |
| 2014 | -- | $1,286,700 | $977,100 | $309,600 |
Source: Public Records
Map
Nearby Homes