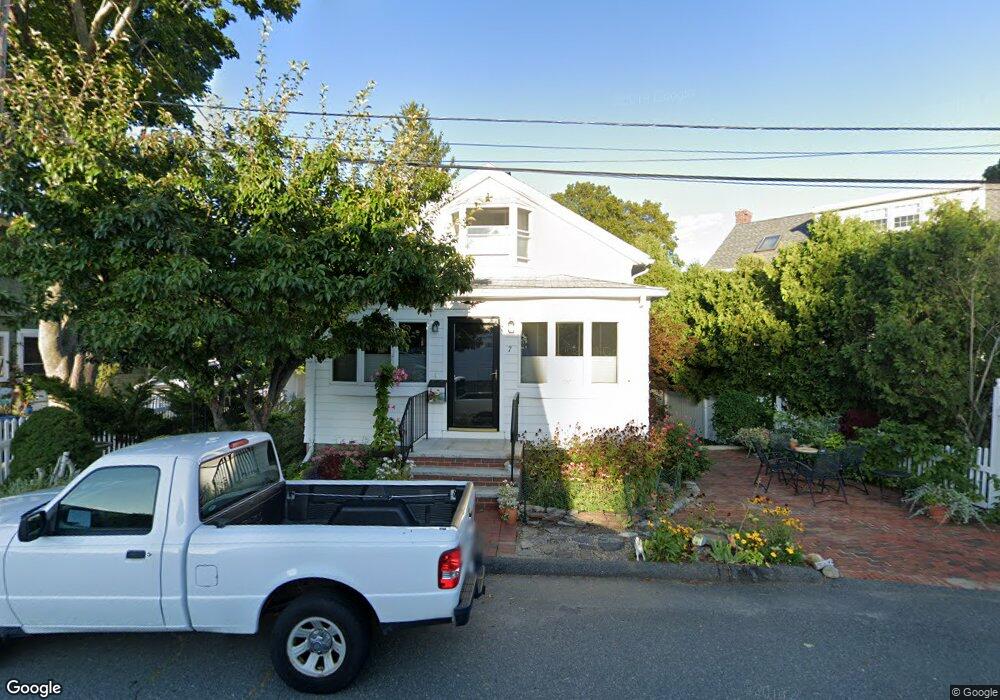
7 Johns Rd Marblehead, MA 01945
Estimated Value: $722,961 - $880,000
3
Beds
2
Baths
1,447
Sq Ft
$553/Sq Ft
Est. Value
About This Home
This home is located at 7 Johns Rd, Marblehead, MA 01945 and is currently estimated at $799,740, approximately $552 per square foot. 7 Johns Rd is a home located in Essex County with nearby schools including Marblehead High School, Marblehead Community Charter Public School, and Tower School.
Ownership History
Date
Name
Owned For
Owner Type
Purchase Details
Closed on
Feb 24, 2015
Sold by
Day Lee D and Day Aileen
Bought by
Day Kristen and Babcock Rebecca
Current Estimated Value
Purchase Details
Closed on
May 25, 1976
Bought by
Day Lee D and Day Aileen
Create a Home Valuation Report for This Property
The Home Valuation Report is an in-depth analysis detailing your home's value as well as a comparison with similar homes in the area
Home Values in the Area
Average Home Value in this Area
Purchase History
| Date | Buyer | Sale Price | Title Company |
|---|---|---|---|
| Day Kristen | -- | -- | |
| Day Kristen | -- | -- | |
| Day Lee D | -- | -- |
Source: Public Records
Mortgage History
| Date | Status | Borrower | Loan Amount |
|---|---|---|---|
| Previous Owner | Day Lee D | $304,000 | |
| Previous Owner | Day Lee D | $300,000 | |
| Previous Owner | Day Lee D | $50,000 | |
| Previous Owner | Day Lee D | $56,000 |
Source: Public Records
Tax History Compared to Growth
Tax History
| Year | Tax Paid | Tax Assessment Tax Assessment Total Assessment is a certain percentage of the fair market value that is determined by local assessors to be the total taxable value of land and additions on the property. | Land | Improvement |
|---|---|---|---|---|
| 2025 | $5,803 | $641,200 | $460,700 | $180,500 |
| 2024 | $5,769 | $643,900 | $495,300 | $148,600 |
| 2023 | $6,012 | $601,200 | $431,900 | $169,300 |
| 2022 | $5,765 | $548,000 | $380,100 | $167,900 |
| 2021 | $5,370 | $515,400 | $368,600 | $146,800 |
| 2020 | $5,033 | $484,400 | $357,000 | $127,400 |
| 2019 | $5,016 | $467,000 | $334,000 | $133,000 |
| 2018 | $5,020 | $455,500 | $322,500 | $133,000 |
| 2017 | $4,588 | $416,700 | $287,900 | $128,800 |
| 2016 | $4,341 | $391,100 | $264,900 | $126,200 |
| 2015 | $4,454 | $402,000 | $253,400 | $148,600 |
| 2014 | $4,037 | $364,000 | $218,800 | $145,200 |
Source: Public Records
Map
Nearby Homes
- 89 Naugus Ave
- 55 Pitman Rd
- 2 Beacon Hill Rd
- 4 Broadmere Way
- 51 Lincoln Ave
- 1 Knollwood Rd
- 66 Jersey St
- 3 Frost Ln Unit 1
- 24 Russell St
- 132 Elm St
- 132 Elm St Unit 132
- 134 Elm St
- 75 Pond St
- 20 Mechanic Square Unit 3
- 20 Mechanic Square Unit 2
- 29 High St
- 7 Mechanic Ct
- 45 Pleasant St
- 5 Winter Island Rd
- 66 Pleasant St Unit 1