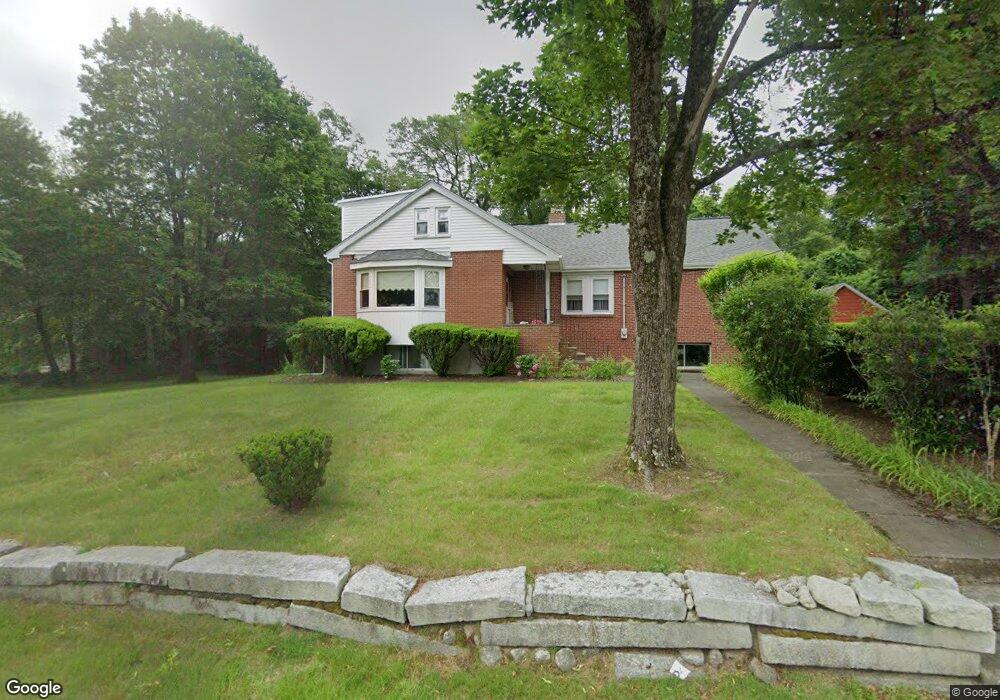
7 Joseph Ln East Walpole, MA 02032
Estimated Value: $881,319 - $1,008,000
3
Beds
4
Baths
2,648
Sq Ft
$355/Sq Ft
Est. Value
About This Home
This home is located at 7 Joseph Ln, East Walpole, MA 02032 and is currently estimated at $939,080, approximately $354 per square foot. 7 Joseph Ln is a home located in Norfolk County with nearby schools including Old Post Road School, Walpole Middle School, and Walpole High School.
Ownership History
Date
Name
Owned For
Owner Type
Purchase Details
Closed on
Sep 19, 2022
Sold by
Mary J Federico Rt
Bought by
Foxboro Rt 2
Current Estimated Value
Home Financials for this Owner
Home Financials are based on the most recent Mortgage that was taken out on this home.
Original Mortgage
$650,000
Outstanding Balance
$622,462
Interest Rate
5.55%
Mortgage Type
Commercial
Estimated Equity
$316,618
Purchase Details
Closed on
Jul 7, 2022
Sold by
Mary J Federico Rt
Bought by
Foxboro Rt 2
Purchase Details
Closed on
Dec 11, 2007
Sold by
Federico Mary J
Bought by
Mary J Federico Rt and Federico Mary J
Purchase Details
Closed on
Apr 3, 2006
Sold by
Ff Rt and Federico Frank
Bought by
Federico Frank and Federico Mary
Home Financials for this Owner
Home Financials are based on the most recent Mortgage that was taken out on this home.
Original Mortgage
$153,090
Interest Rate
6.32%
Mortgage Type
Purchase Money Mortgage
Create a Home Valuation Report for This Property
The Home Valuation Report is an in-depth analysis detailing your home's value as well as a comparison with similar homes in the area
Home Values in the Area
Average Home Value in this Area
Purchase History
| Date | Buyer | Sale Price | Title Company |
|---|---|---|---|
| Foxboro Rt 2 | -- | None Available | |
| Mary J Federico Rt | -- | None Available | |
| Foxboro Rt 2 | -- | None Available | |
| Mary J Federico Rt | -- | -- | |
| Federico Frank | -- | -- |
Source: Public Records
Mortgage History
| Date | Status | Borrower | Loan Amount |
|---|---|---|---|
| Open | Foxboro Rt 2 | $650,000 | |
| Previous Owner | Federico Frank | $153,090 |
Source: Public Records
Tax History Compared to Growth
Tax History
| Year | Tax Paid | Tax Assessment Tax Assessment Total Assessment is a certain percentage of the fair market value that is determined by local assessors to be the total taxable value of land and additions on the property. | Land | Improvement |
|---|---|---|---|---|
| 2025 | $9,674 | $754,000 | $331,700 | $422,300 |
| 2024 | $9,362 | $708,200 | $318,800 | $389,400 |
| 2023 | $8,880 | $639,300 | $277,200 | $362,100 |
| 2022 | $8,372 | $579,000 | $256,700 | $322,300 |
| 2021 | $7,813 | $526,500 | $242,200 | $284,300 |
| 2020 | $7,461 | $497,700 | $228,400 | $269,300 |
| 2019 | $7,346 | $486,500 | $219,500 | $267,000 |
| 2018 | $7,223 | $473,000 | $211,500 | $261,500 |
| 2017 | $6,967 | $454,500 | $203,300 | $251,200 |
| 2016 | $6,818 | $438,200 | $197,300 | $240,900 |
| 2015 | $6,602 | $420,500 | $188,100 | $232,400 |
| 2014 | $6,328 | $401,500 | $188,100 | $213,400 |
Source: Public Records
Map
Nearby Homes
- 93 Brewster Dr
- Unit 11 Powder House Ln Unit 11
- 8 Powder House Ln Unit 2
- Unit 12 Powder House Ln Unit 12
- Unit 3 Powder House Ln Unit 3
- 256 Norwood St
- 11 Park Ln
- 38 Cape Club Dr Unit 38
- 40 Cape Club Dr Unit 40
- 270 Moosehill Rd
- 26 Bullard St
- 30 Bullard St
- 10 Cobbler Ln
- 0 Charlotte Rd
- 7 Washington Green
- 363 - 367 Washington St
- 4 Cortland Dr
- 1 Palace Ct
- 486 Washington St
- 277 Everett St