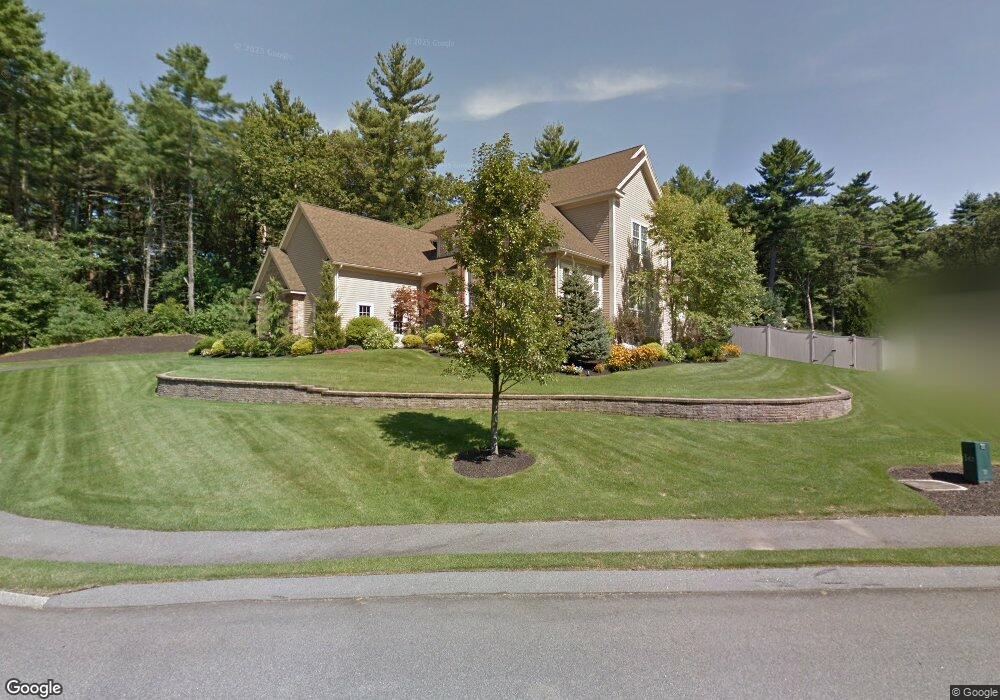
7 Joseph Ln Lynnfield, MA 01940
Estimated Value: $1,919,639 - $2,204,000
4
Beds
5
Baths
4,200
Sq Ft
$499/Sq Ft
Est. Value
About This Home
This home is located at 7 Joseph Ln, Lynnfield, MA 01940 and is currently estimated at $2,095,660, approximately $498 per square foot. 7 Joseph Ln is a home located in Essex County with nearby schools including Pickering Middle School, Lynnfield High School, and Covenant Christian Academy.
Ownership History
Date
Name
Owned For
Owner Type
Purchase Details
Closed on
Feb 7, 2022
Sold by
Hook James J
Bought by
Hook Family Joint T
Current Estimated Value
Purchase Details
Closed on
Mar 31, 2016
Sold by
Hook Shelly A
Bought by
Hook James J
Purchase Details
Closed on
Jul 21, 2010
Sold by
Hook James J and Hook Shelly A
Bought by
Hook Shelly A
Purchase Details
Closed on
Oct 31, 2007
Sold by
Joseph Lane Llc
Bought by
Hook James J and Hook Shelly A
Home Financials for this Owner
Home Financials are based on the most recent Mortgage that was taken out on this home.
Original Mortgage
$417,000
Interest Rate
6.43%
Mortgage Type
Purchase Money Mortgage
Create a Home Valuation Report for This Property
The Home Valuation Report is an in-depth analysis detailing your home's value as well as a comparison with similar homes in the area
Home Values in the Area
Average Home Value in this Area
Purchase History
| Date | Buyer | Sale Price | Title Company |
|---|---|---|---|
| Hook Family Joint T | -- | None Available | |
| Hook James J | -- | -- | |
| Hook Shelly A | -- | -- | |
| Hook James J | $1,519,000 | -- |
Source: Public Records
Mortgage History
| Date | Status | Borrower | Loan Amount |
|---|---|---|---|
| Previous Owner | Hook James J | $409,000 | |
| Previous Owner | Hook James J | $417,000 |
Source: Public Records
Tax History Compared to Growth
Tax History
| Year | Tax Paid | Tax Assessment Tax Assessment Total Assessment is a certain percentage of the fair market value that is determined by local assessors to be the total taxable value of land and additions on the property. | Land | Improvement |
|---|---|---|---|---|
| 2025 | $18,780 | $1,778,400 | $804,000 | $974,400 |
| 2024 | $17,391 | $1,654,700 | $744,500 | $910,200 |
| 2023 | $16,806 | $1,487,300 | $680,800 | $806,500 |
| 2022 | $16,454 | $1,372,300 | $680,800 | $691,500 |
| 2021 | $15,733 | $1,185,600 | $595,800 | $589,800 |
| 2020 | $15,799 | $1,135,000 | $541,400 | $593,600 |
| 2019 | $15,362 | $1,104,400 | $510,800 | $593,600 |
| 2018 | $15,197 | $1,104,400 | $510,800 | $593,600 |
| 2017 | $14,710 | $1,067,500 | $510,800 | $556,700 |
| 2016 | $13,384 | $923,000 | $436,400 | $486,600 |
| 2015 | $12,673 | $874,600 | $436,400 | $438,200 |
Source: Public Records
Map
Nearby Homes