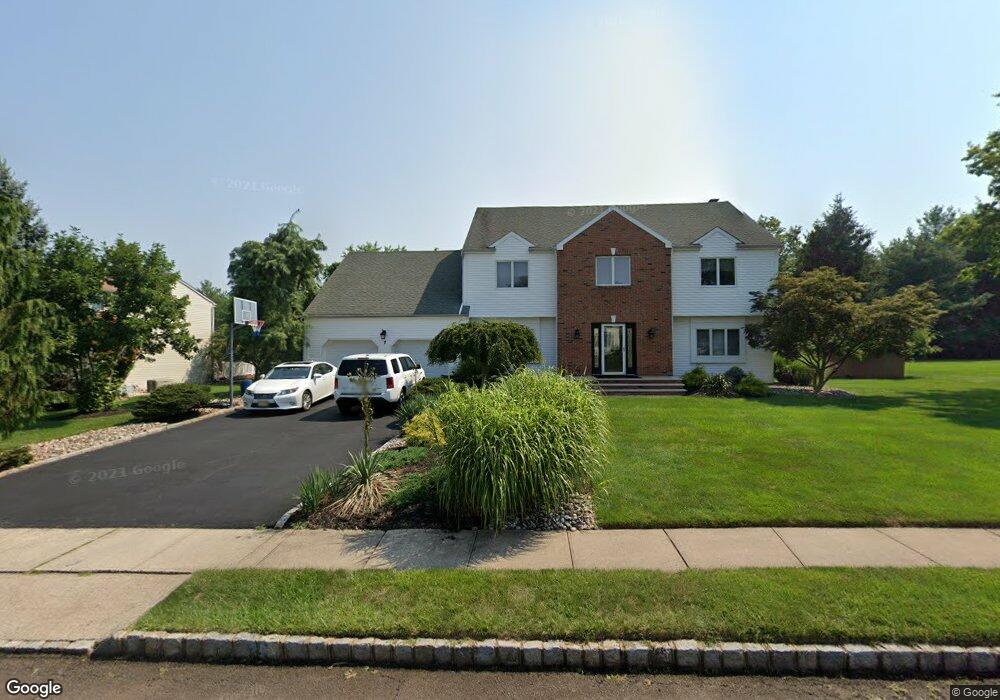
7 Joshua Dr Hillsborough, NJ 08844
Estimated Value: $930,000 - $979,000
--
Bed
--
Bath
3,124
Sq Ft
$305/Sq Ft
Est. Value
About This Home
This home is located at 7 Joshua Dr, Hillsborough, NJ 08844 and is currently estimated at $952,534, approximately $304 per square foot. 7 Joshua Dr is a home located in Somerset County with nearby schools including Hillsborough High School and Brighthorizons at Hillsborough.
Ownership History
Date
Name
Owned For
Owner Type
Purchase Details
Closed on
Aug 27, 2021
Sold by
Faillace Mark and Faillace Maryann
Bought by
Mitra Ananya and Ray Mandakini
Current Estimated Value
Home Financials for this Owner
Home Financials are based on the most recent Mortgage that was taken out on this home.
Original Mortgage
$600,000
Outstanding Balance
$545,140
Interest Rate
2.7%
Mortgage Type
New Conventional
Estimated Equity
$407,394
Purchase Details
Closed on
Aug 17, 1998
Sold by
Parr Deborah
Bought by
Faillace Mark and Faillace Maryann
Home Financials for this Owner
Home Financials are based on the most recent Mortgage that was taken out on this home.
Original Mortgage
$220,000
Interest Rate
6.86%
Purchase Details
Closed on
Mar 22, 1993
Sold by
Anchor Mortgage Services Inx
Bought by
Steinberg Steinberg Jr U and Steinberg Parr,D J
Purchase Details
Closed on
May 6, 1992
Sold by
Lund Robert H Et Als
Bought by
Anchor Mortgage Services Inc
Create a Home Valuation Report for This Property
The Home Valuation Report is an in-depth analysis detailing your home's value as well as a comparison with similar homes in the area
Home Values in the Area
Average Home Value in this Area
Purchase History
| Date | Buyer | Sale Price | Title Company |
|---|---|---|---|
| Mitra Ananya | $750,000 | Hilltop Title Llc | |
| Faillace Mark | $330,000 | -- | |
| Steinberg Steinberg Jr U | $247,500 | -- | |
| Anchor Mortgage Services Inc | $100 | -- |
Source: Public Records
Mortgage History
| Date | Status | Borrower | Loan Amount |
|---|---|---|---|
| Open | Mitra Ananya | $600,000 | |
| Previous Owner | Faillace Mark | $220,000 |
Source: Public Records
Tax History Compared to Growth
Tax History
| Year | Tax Paid | Tax Assessment Tax Assessment Total Assessment is a certain percentage of the fair market value that is determined by local assessors to be the total taxable value of land and additions on the property. | Land | Improvement |
|---|---|---|---|---|
| 2025 | $16,167 | $827,000 | $402,000 | $425,000 |
| 2024 | $16,167 | $754,400 | $367,000 | $387,400 |
| 2023 | $14,901 | $692,100 | $317,000 | $375,100 |
| 2022 | $14,459 | $647,500 | $317,100 | $330,400 |
| 2021 | $14,203 | $604,900 | $272,100 | $332,800 |
| 2020 | $13,987 | $586,700 | $252,100 | $334,600 |
| 2019 | $13,787 | $573,500 | $237,100 | $336,400 |
| 2018 | $13,365 | $552,500 | $222,100 | $330,400 |
| 2017 | $13,196 | $546,400 | $212,100 | $334,300 |
| 2016 | $12,992 | $538,200 | $202,100 | $336,100 |
| 2015 | $12,530 | $525,600 | $187,100 | $338,500 |
| 2014 | $11,843 | $507,400 | $167,100 | $340,300 |
Source: Public Records
Map
Nearby Homes