Estimated Value: $84,148 - $130,000
--
Bed
--
Bath
768
Sq Ft
$140/Sq Ft
Est. Value
About This Home
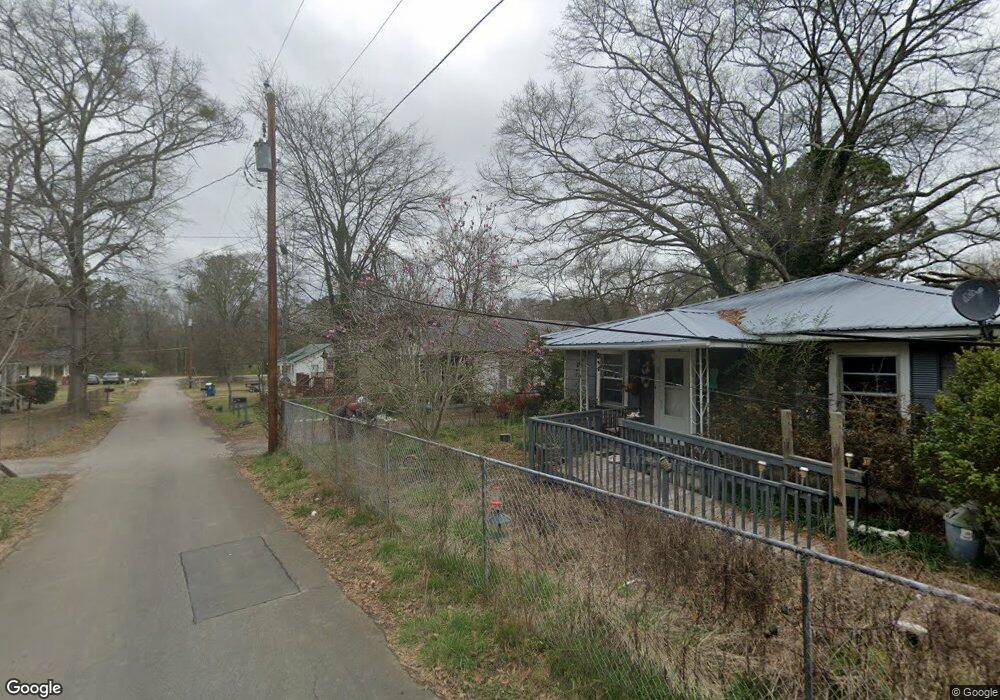
This home is located at 7 Kennemore Rd SW, Rome, GA 30165 and is currently estimated at $107,537, approximately $140 per square foot. 7 Kennemore Rd SW is a home located in Floyd County with nearby schools including Coosa Middle School, Coosa High School, and Darlington School.
Ownership History
Date
Name
Owned For
Owner Type
Purchase Details
Closed on
Mar 27, 2013
Sold by
Gamble Brondell C
Bought by
Gamble Douglas W and Gamble Brondell C
Current Estimated Value
Purchase Details
Closed on
May 3, 1989
Sold by
Marquis James D and Marquis Alana C
Bought by
Gamble Brondell C
Purchase Details
Closed on
May 9, 1984
Sold by
Dobbins Sammy D
Bought by
Marquis James D and Marquis Alana C
Purchase Details
Closed on
Mar 24, 1982
Sold by
Hall Morris and Hall Hope
Bought by
Dobbins Sammy D
Purchase Details
Closed on
Oct 19, 1981
Sold by
Osborn John T
Bought by
Hall Morris and Hall Hope
Purchase Details
Closed on
Aug 13, 1976
Sold by
Lucus Ben
Bought by
Osborn John T
Purchase Details
Closed on
Jul 15, 1976
Sold by
Clark Thomas Michael
Bought by
Lucus Ben
Purchase Details
Closed on
Dec 28, 1973
Sold by
Rogers Barbara
Bought by
Clark Thomas Michael
Purchase Details
Closed on
Jan 1, 1971
Sold by
Rogers Melvin Lee
Bought by
Rogers Barbara
Purchase Details
Closed on
Jan 1, 1959
Bought by
Rogers Melvin Lee
Create a Home Valuation Report for This Property
The Home Valuation Report is an in-depth analysis detailing your home's value as well as a comparison with similar homes in the area
Home Values in the Area
Average Home Value in this Area
Purchase History
| Date | Buyer | Sale Price | Title Company |
|---|---|---|---|
| Gamble Douglas W | -- | -- | |
| Gamble Brondell C | -- | -- | |
| Marquis James D | $18,300 | -- | |
| Dobbins Sammy D | $18,500 | -- | |
| Hall Morris | $17,000 | -- | |
| Osborn John T | $14,900 | -- | |
| Lucus Ben | -- | -- | |
| Clark Thomas Michael | $13,700 | -- | |
| Rogers Barbara | -- | -- | |
| Rogers Melvin Lee | -- | -- |
Source: Public Records
Tax History Compared to Growth
Tax History
| Year | Tax Paid | Tax Assessment Tax Assessment Total Assessment is a certain percentage of the fair market value that is determined by local assessors to be the total taxable value of land and additions on the property. | Land | Improvement |
|---|---|---|---|---|
| 2024 | $45 | $17,793 | $2,561 | $15,232 |
| 2023 | $45 | $16,885 | $2,328 | $14,557 |
| 2022 | $46 | $13,799 | $1,862 | $11,937 |
| 2021 | $46 | $12,442 | $1,862 | $10,580 |
| 2020 | $47 | $11,307 | $1,397 | $9,910 |
| 2019 | $45 | $10,657 | $1,397 | $9,260 |
| 2018 | $45 | $9,909 | $1,397 | $8,512 |
| 2017 | $45 | $9,515 | $1,397 | $8,118 |
| 2016 | $46 | $9,214 | $1,360 | $7,854 |
| 2015 | $42 | $9,214 | $1,360 | $7,854 |
| 2014 | $42 | $9,214 | $1,360 | $7,854 |
Source: Public Records
Map
Nearby Homes
- 0 Mount Alto Rd SW Unit 10523740
- 13 Ridgewood Rd SW
- 311 Wilkerson Rd SW
- 50 Melton Ave SW
- 204 Cherry St SW
- 313 Wilkerson Rd SW
- 14 Berckman Ln SW
- 55 Ridgewood Rd SW
- 28 Mountain Crest Dr SW
- 3 Berckman Ln SW
- 19 Berckman Ln SW
- 8 S Hughes St SW
- 438 Wilkerson Rd SW
- 8 Leon St SW
- 40 Paris Dr SW
- 207 Paris Dr SW
- 209 Sherwood Rd SW
- 40 Hawk Spring Dr SW
- 9 Shorter Cir SW
- 22 Southfork Dr SW
- 5 Kennemore Rd SW
- 9 Kennemore Rd SW
- 3 Kennemore Rd SW
- 15 Wilkerson Rd SW
- 6 Kennemore Rd SW
- 11 Kennemore Rd SW
- 10 Kennemore Rd SW
- 12 Kennemore Rd SW
- 13 Kennemore Rd SW
- 2 Kennemore Rd SW
- 0 Kinnemore Rd Unit 10329904
- 0 Kinnemore Rd Unit 10329900
- 0 Kinnemore Rd Unit 10242988
- 0 Kinnemore Rd Unit 10242985
- 0 Kinnemore Rd Unit 10028859
- 0 Kinnemore Rd Unit 10028858
- 9 Wilkerson Rd SW Unit P
- 9 Wilkerson Rd SW Unit B
- 9 Wilkerson Rd SW
- 103 Wilkerson Rd SW