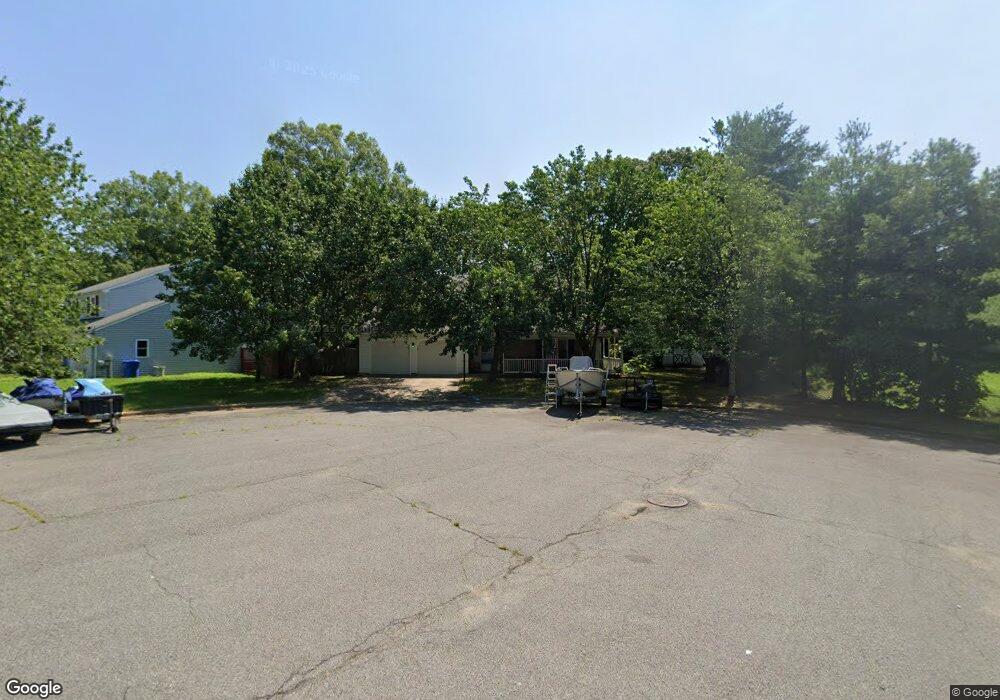
7 Kenrick Ct Indian Head, MD 20640
Estimated Value: $340,000 - $428,000
--
Bed
3
Baths
2,158
Sq Ft
$180/Sq Ft
Est. Value
About This Home
This home is located at 7 Kenrick Ct, Indian Head, MD 20640 and is currently estimated at $389,098, approximately $180 per square foot. 7 Kenrick Ct is a home located in Charles County with nearby schools including Indian Head Elementary School, General Smallwood Middle School, and Henry E. Lackey High School.
Ownership History
Date
Name
Owned For
Owner Type
Purchase Details
Closed on
Oct 22, 2001
Sold by
Stone Donna
Bought by
Stone Donna Thomas J Collins
Current Estimated Value
Purchase Details
Closed on
May 11, 1999
Sold by
Secretary Of Veterans Affairs
Bought by
Stone Donna
Purchase Details
Closed on
Oct 5, 1998
Sold by
Campbell Edward J
Bought by
Secretary Of Vererans Affairs
Purchase Details
Closed on
Oct 8, 1997
Sold by
Campbell Edward J and Campbell Janet
Bought by
Campbell Edward J
Create a Home Valuation Report for This Property
The Home Valuation Report is an in-depth analysis detailing your home's value as well as a comparison with similar homes in the area
Home Values in the Area
Average Home Value in this Area
Purchase History
| Date | Buyer | Sale Price | Title Company |
|---|---|---|---|
| Stone Donna Thomas J Collins | -- | -- | |
| Stone Donna | $141,150 | -- | |
| Secretary Of Vererans Affairs | $140,229 | -- | |
| Campbell Edward J | -- | -- |
Source: Public Records
Mortgage History
| Date | Status | Borrower | Loan Amount |
|---|---|---|---|
| Open | Stone Donna | $200,000 | |
| Closed | Stone Donna | $177,000 | |
| Closed | Stone Donna | $183,228 | |
| Closed | Stone Donna | $188,500 | |
| Closed | Stone Donna | $50,000 | |
| Closed | Stone Donna | $160,000 | |
| Closed | Stone Donna | $35,000 | |
| Closed | Stone Donna | -- |
Source: Public Records
Tax History Compared to Growth
Tax History
| Year | Tax Paid | Tax Assessment Tax Assessment Total Assessment is a certain percentage of the fair market value that is determined by local assessors to be the total taxable value of land and additions on the property. | Land | Improvement |
|---|---|---|---|---|
| 2025 | $11,594 | $351,200 | $70,000 | $281,200 |
| 2024 | $5,408 | $332,433 | $0 | $0 |
| 2023 | $5,423 | $313,667 | $0 | $0 |
| 2022 | $4,675 | $294,900 | $64,000 | $230,900 |
| 2021 | $2,007 | $281,067 | $0 | $0 |
| 2020 | $4,245 | $267,233 | $0 | $0 |
| 2019 | $4,033 | $253,400 | $60,000 | $193,400 |
| 2018 | $3,315 | $251,733 | $0 | $0 |
| 2017 | $1,704 | $250,067 | $0 | $0 |
| 2016 | -- | $248,400 | $0 | $0 |
| 2015 | $3,394 | $242,967 | $0 | $0 |
| 2014 | $3,394 | $237,533 | $0 | $0 |
Source: Public Records
Map
Nearby Homes
- 13 Beth Ct
- 117 Riverside Run Dr
- 9 Beth Ct
- 21 Meadowside Ct
- 14 Oakside Ln
- 3 Oakside Ln
- 1 Meadowside Ct
- 3 Riverside Run Dr
- 132 Charles Place
- 408 Bland Dr
- lot 1 Travers Rd
- 10 Prospect Ave
- 401 Indian Head Ave
- 4350 Strauss Ave
- 4601 Strauss Ave
- 105 Bland Dr
- 41 Dove Tree Ct
- 26 Lookout Dr
- 105 Caswell Dr
- 45 Mattingly Ave