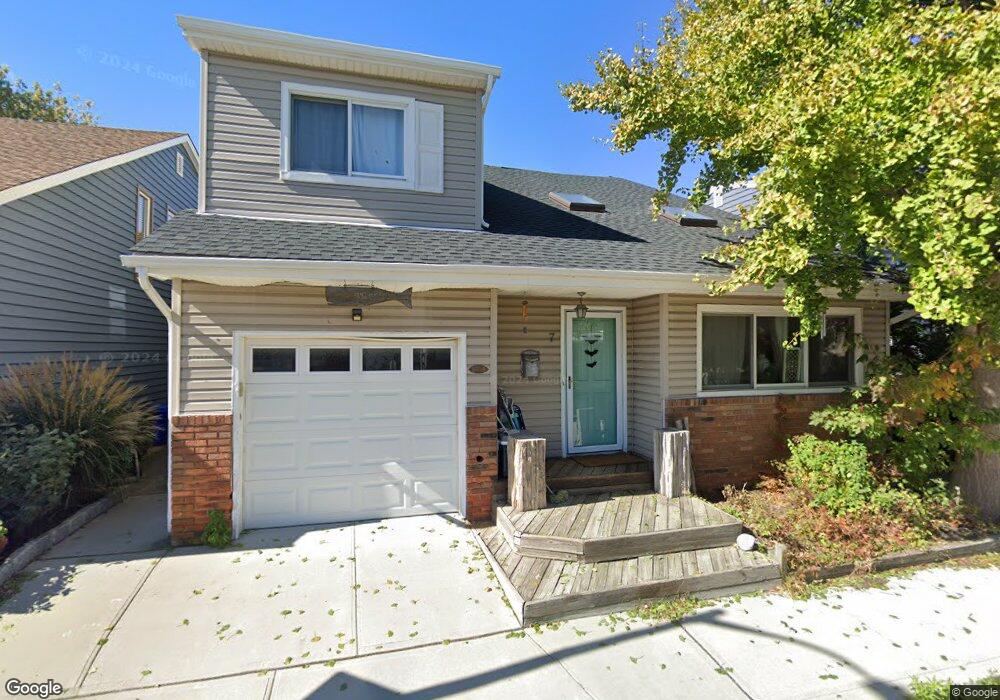
7 Kerrigan St Long Beach, NY 11561
Estimated Value: $647,000 - $776,624
3
Beds
2
Baths
1,675
Sq Ft
$425/Sq Ft
Est. Value
About This Home
This home is located at 7 Kerrigan St, Long Beach, NY 11561 and is currently estimated at $711,812, approximately $424 per square foot. 7 Kerrigan St is a home located in Nassau County with nearby schools including Lido Elementary School, East Elementary School, and Lindell Elementary School.
Ownership History
Date
Name
Owned For
Owner Type
Purchase Details
Closed on
Mar 5, 2019
Sold by
Phillips Amy
Bought by
Heumann Allison J and First Ellen
Current Estimated Value
Home Financials for this Owner
Home Financials are based on the most recent Mortgage that was taken out on this home.
Original Mortgage
$479,750
Outstanding Balance
$421,782
Interest Rate
4.4%
Mortgage Type
New Conventional
Estimated Equity
$290,030
Purchase Details
Closed on
Aug 14, 1998
Sold by
Verch Eric
Bought by
Phillips Alexander and Vigod Amy L
Purchase Details
Closed on
Jun 16, 1995
Sold by
Suskauer Joan
Bought by
Verch Eric and Verch Jill
Home Financials for this Owner
Home Financials are based on the most recent Mortgage that was taken out on this home.
Original Mortgage
$100,000
Interest Rate
7.56%
Create a Home Valuation Report for This Property
The Home Valuation Report is an in-depth analysis detailing your home's value as well as a comparison with similar homes in the area
Home Values in the Area
Average Home Value in this Area
Purchase History
| Date | Buyer | Sale Price | Title Company |
|---|---|---|---|
| Heumann Allison J | $505,000 | None Available | |
| Phillips Amy L | -- | None Available | |
| Phillips Alexander | $225,000 | -- | |
| Verch Eric | $235,500 | -- | |
| Verch Eric | $235,500 | -- |
Source: Public Records
Mortgage History
| Date | Status | Borrower | Loan Amount |
|---|---|---|---|
| Open | Heumann Allison J | $479,750 | |
| Previous Owner | Verch Eric | $100,000 |
Source: Public Records
Tax History Compared to Growth
Tax History
| Year | Tax Paid | Tax Assessment Tax Assessment Total Assessment is a certain percentage of the fair market value that is determined by local assessors to be the total taxable value of land and additions on the property. | Land | Improvement |
|---|---|---|---|---|
| 2025 | $6,912 | $480 | $238 | $242 |
| 2024 | $887 | $480 | $238 | $242 |
| 2023 | $7,465 | $508 | $262 | $246 |
| 2022 | $7,465 | $480 | $238 | $242 |
| 2021 | $14,726 | $505 | $154 | $351 |
| 2020 | $12,165 | $1,088 | $656 | $432 |
| 2019 | $1,505 | $1,088 | $656 | $432 |
| 2018 | $1,399 | $1,088 | $0 | $0 |
| 2017 | $7,240 | $1,088 | $656 | $432 |
| 2016 | $1,343 | $1,088 | $656 | $432 |
| 2015 | $1,335 | $1,088 | $656 | $432 |
| 2014 | $1,335 | $1,088 | $656 | $432 |
| 2013 | $1,276 | $1,088 | $656 | $432 |
Source: Public Records
Map
Nearby Homes
- 27 Kerrigan St
- 10 Kirkwood St
- 625 E Walnut St
- 570 E Chester St
- 732 E Park Ave
- 661 E Olive St
- 755 E Chester St
- 7 Vinton St
- 215 Roosevelt Blvd
- 580 E Pine St
- 23 Vinton St
- 49 Barnes St
- 12 Vinton St
- 545 E Fulton St
- 134 Coolidge Ave
- 63 Kirkwood St
- 18 Clark St
- 535 E Olive St
- 124 Coolidge Ave
- 129 Belmont Ave