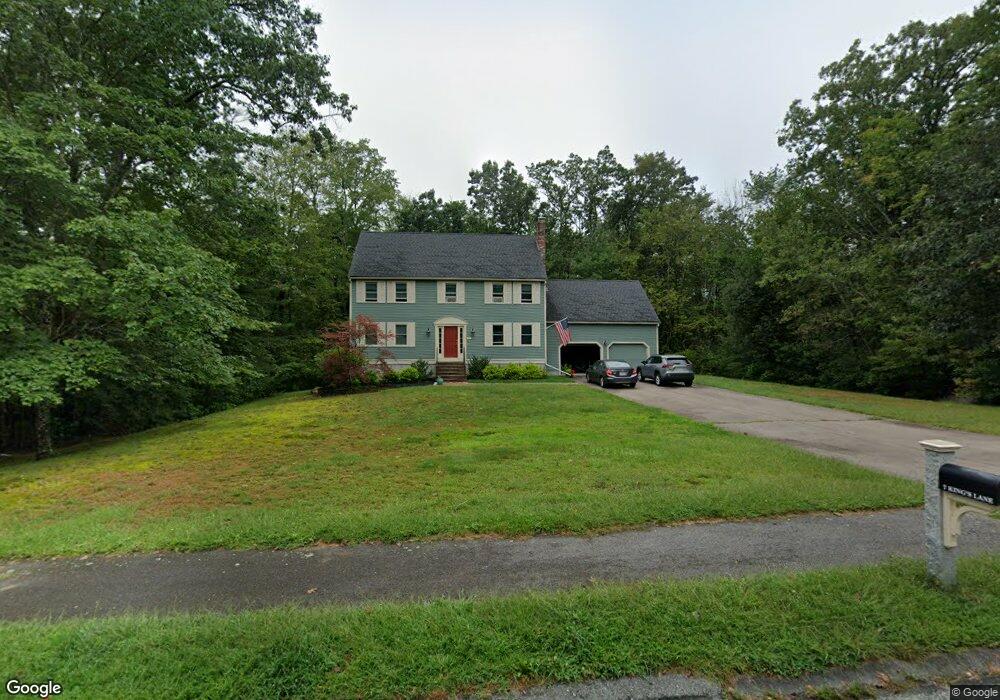
7 Kings Ln Medway, MA 02053
Estimated Value: $761,234 - $943,000
4
Beds
3
Baths
2,294
Sq Ft
$372/Sq Ft
Est. Value
About This Home
This home is located at 7 Kings Ln, Medway, MA 02053 and is currently estimated at $852,809, approximately $371 per square foot. 7 Kings Ln is a home located in Norfolk County with nearby schools including John D. McGovern Elementary School, Burke-Memorial Elementary, and Medway Middle School.
Ownership History
Date
Name
Owned For
Owner Type
Purchase Details
Closed on
Aug 30, 1994
Sold by
Kings Ln Rt
Bought by
Seiss Richard R and Seiss Susan E
Current Estimated Value
Home Financials for this Owner
Home Financials are based on the most recent Mortgage that was taken out on this home.
Original Mortgage
$135,000
Interest Rate
8.65%
Mortgage Type
Purchase Money Mortgage
Create a Home Valuation Report for This Property
The Home Valuation Report is an in-depth analysis detailing your home's value as well as a comparison with similar homes in the area
Home Values in the Area
Average Home Value in this Area
Purchase History
| Date | Buyer | Sale Price | Title Company |
|---|---|---|---|
| Seiss Richard R | $234,900 | -- |
Source: Public Records
Mortgage History
| Date | Status | Borrower | Loan Amount |
|---|---|---|---|
| Closed | Seiss Richard R | $135,000 |
Source: Public Records
Tax History
| Year | Tax Paid | Tax Assessment Tax Assessment Total Assessment is a certain percentage of the fair market value that is determined by local assessors to be the total taxable value of land and additions on the property. | Land | Improvement |
|---|---|---|---|---|
| 2025 | $10,156 | $712,700 | $323,400 | $389,300 |
| 2024 | $10,263 | $712,700 | $323,400 | $389,300 |
| 2023 | $10,144 | $636,400 | $294,300 | $342,100 |
| 2022 | $9,330 | $551,100 | $217,600 | $333,500 |
| 2021 | $9,296 | $532,400 | $203,100 | $329,300 |
| 2020 | $9,265 | $529,400 | $203,100 | $326,300 |
| 2019 | $8,638 | $509,000 | $194,800 | $314,200 |
| 2018 | $8,708 | $493,100 | $186,600 | $306,500 |
| 2017 | $8,623 | $481,200 | $182,400 | $298,800 |
| 2016 | $8,262 | $456,200 | $167,900 | $288,300 |
| 2015 | $8,193 | $449,200 | $165,800 | $283,400 |
| 2014 | $7,918 | $420,300 | $165,800 | $254,500 |
Source: Public Records
Map
Nearby Homes
- 253 Village St
- 58 Holliston St
- 19 Evergreen St Unit A
- 8 Winthrop St
- 20 Broad St Unit 1
- 20 Broad St Unit 6
- 20 Broad St Unit A
- 20 Broad St Unit 4
- 14 Sanford St Unit 47
- 10 Barber St
- 50 Main St
- 10 Franklin St
- 33 Gorwin Dr
- 1391 Pond St
- 839 Lincoln St
- 8 Woodhaven Dr
- 79 Lovering St Unit B
- 29 Elm St
- 6 Freedom Trail
- 4 Linda Ln
Your Personal Tour Guide
Ask me questions while you tour the home.