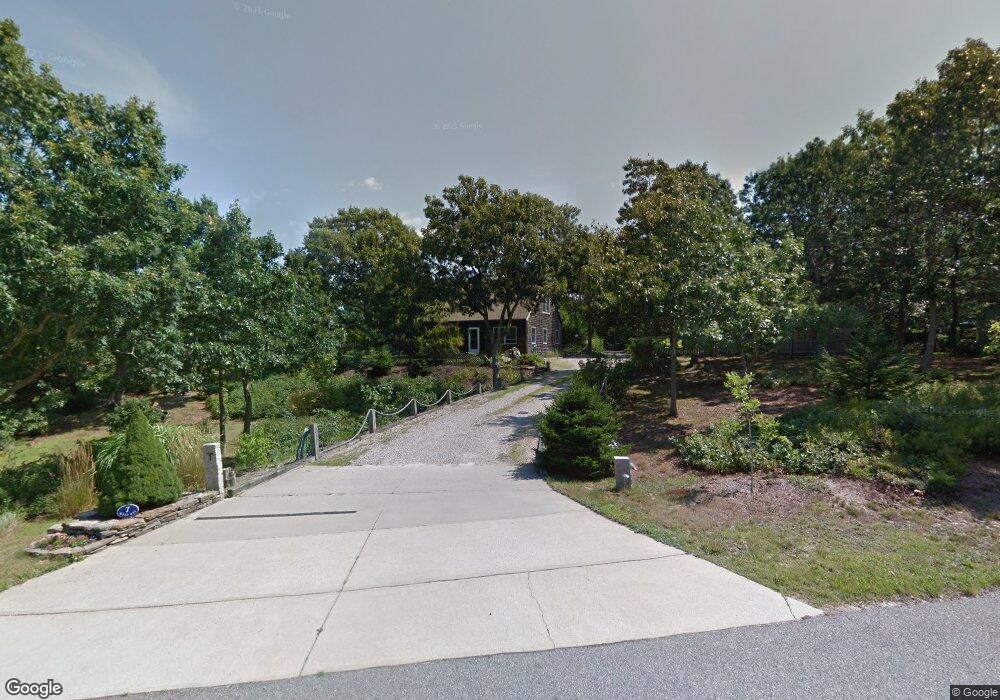
7 Kyle Way North Truro, MA 2652
Estimated Value: $1,010,363 - $1,231,000
3
Beds
2
Baths
1,764
Sq Ft
$639/Sq Ft
Est. Value
About This Home
This home is located at 7 Kyle Way, North Truro, MA 2652 and is currently estimated at $1,127,841, approximately $639 per square foot. 7 Kyle Way is a home located in Barnstable County with nearby schools including Truro Central School.
Ownership History
Date
Name
Owned For
Owner Type
Purchase Details
Closed on
Dec 9, 2016
Sold by
Tarvers Michael and Tarvers Linda
Bought by
Robbins Michael D and Robbins Carole J
Current Estimated Value
Home Financials for this Owner
Home Financials are based on the most recent Mortgage that was taken out on this home.
Original Mortgage
$417,000
Outstanding Balance
$216,303
Interest Rate
3.47%
Mortgage Type
Unknown
Estimated Equity
$911,538
Purchase Details
Closed on
Nov 26, 2003
Sold by
Tarvers Nt and Tarvers Nancy L
Bought by
M & L Tarvers Nt and Tarvers Bruce T
Home Financials for this Owner
Home Financials are based on the most recent Mortgage that was taken out on this home.
Original Mortgage
$150,000
Interest Rate
6.09%
Mortgage Type
Purchase Money Mortgage
Create a Home Valuation Report for This Property
The Home Valuation Report is an in-depth analysis detailing your home's value as well as a comparison with similar homes in the area
Home Values in the Area
Average Home Value in this Area
Purchase History
| Date | Buyer | Sale Price | Title Company |
|---|---|---|---|
| Robbins Michael D | $582,000 | -- | |
| M & L Tarvers Nt | $150,000 | -- |
Source: Public Records
Mortgage History
| Date | Status | Borrower | Loan Amount |
|---|---|---|---|
| Open | Robbins Michael D | $417,000 | |
| Previous Owner | M & L Tarvers Nt | $150,000 | |
| Previous Owner | M & L Tarvers Nt | $100,000 |
Source: Public Records
Tax History Compared to Growth
Tax History
| Year | Tax Paid | Tax Assessment Tax Assessment Total Assessment is a certain percentage of the fair market value that is determined by local assessors to be the total taxable value of land and additions on the property. | Land | Improvement |
|---|---|---|---|---|
| 2025 | $5,568 | $900,900 | $283,700 | $617,200 |
| 2024 | $5,248 | $876,200 | $280,900 | $595,300 |
| 2023 | $4,945 | $756,100 | $244,200 | $511,900 |
| 2022 | $4,592 | $594,000 | $210,500 | $383,500 |
| 2021 | $4,211 | $570,600 | $221,000 | $349,600 |
| 2020 | $4,170 | $568,900 | $218,800 | $350,100 |
| 2019 | $3,823 | $513,200 | $218,800 | $294,400 |
| 2018 | $3,605 | $489,200 | $218,800 | $270,400 |
| 2017 | $3,259 | $466,900 | $208,400 | $258,500 |
| 2016 | $3,342 | $493,700 | $237,300 | $256,400 |
| 2015 | $3,214 | $484,700 | $235,000 | $249,700 |
Source: Public Records
Map
Nearby Homes
- 4 S Highland Rd Unit C
- 22 Shore Rd
- 7 Fishermans Rd
- 18 Hopkins Way
- 25 Noons Dr
- 14 N Union Field Rd
- 3 Bayberry Rd
- 6 Professional Heights Rd Unit 1
- 7 Great Hollow Rd Unit 50
- 4 Highland Rd Unit C
- 7 Great Hollow Rd Unit 50
- 23 Crestview Cir
- 27 Fishermans Rd
- 72 Highland Rd
- 2 Aldrich Rd
- 2 Amanda Ln
- 5 Sylvan Ln
- 32 Twine Field Rd
- 6 Long Nook Ln
- 4 Resolution Rd