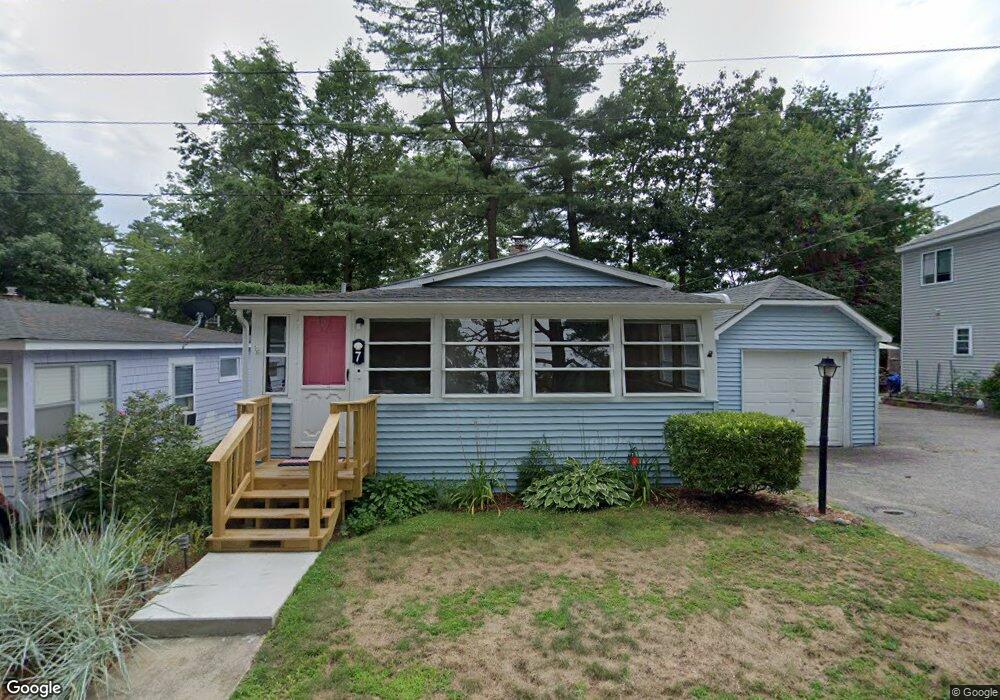
7 Lake Ave Old Orchard Beach, ME 04064
Estimated Value: $411,000 - $549,642
3
Beds
2
Baths
1,544
Sq Ft
$307/Sq Ft
Est. Value
About This Home
This home is located at 7 Lake Ave, Old Orchard Beach, ME 04064 and is currently estimated at $474,411, approximately $307 per square foot. 7 Lake Ave is a home located in York County with nearby schools including Jameson Elementary School, Loranger Memorial School, and Old Orchard Beach High School.
Ownership History
Date
Name
Owned For
Owner Type
Purchase Details
Closed on
Sep 4, 2024
Sold by
Laychur Elizabeth L
Bought by
Bednarz Stephen E
Current Estimated Value
Purchase Details
Closed on
Apr 15, 2022
Sold by
Daigle Lorraine C
Bought by
Wingrove Robert G and Carrabba Caryn J
Home Financials for this Owner
Home Financials are based on the most recent Mortgage that was taken out on this home.
Original Mortgage
$262,500
Interest Rate
3.76%
Mortgage Type
Purchase Money Mortgage
Create a Home Valuation Report for This Property
The Home Valuation Report is an in-depth analysis detailing your home's value as well as a comparison with similar homes in the area
Home Values in the Area
Average Home Value in this Area
Purchase History
| Date | Buyer | Sale Price | Title Company |
|---|---|---|---|
| Bednarz Stephen E | -- | None Available | |
| Bednarz Stephen E | -- | None Available | |
| Wingrove Robert G | $350,000 | None Available |
Source: Public Records
Mortgage History
| Date | Status | Borrower | Loan Amount |
|---|---|---|---|
| Previous Owner | Wingrove Robert G | $262,500 |
Source: Public Records
Tax History Compared to Growth
Tax History
| Year | Tax Paid | Tax Assessment Tax Assessment Total Assessment is a certain percentage of the fair market value that is determined by local assessors to be the total taxable value of land and additions on the property. | Land | Improvement |
|---|---|---|---|---|
| 2024 | $3,649 | $335,400 | $112,200 | $223,200 |
| 2023 | $3,331 | $292,200 | $93,800 | $198,400 |
| 2022 | $3,086 | $252,100 | $71,800 | $180,300 |
| 2021 | $2,889 | $204,000 | $58,700 | $145,300 |
| 2020 | $2,091 | $135,600 | $50,900 | $84,700 |
| 2019 | $2,102 | $135,600 | $50,900 | $84,700 |
| 2018 | $1,917 | $133,800 | $50,900 | $82,900 |
| 2017 | $1,931 | $123,000 | $44,200 | $78,800 |
| 2016 | $1,889 | $122,200 | $43,400 | $78,800 |
| 2015 | $1,855 | $122,200 | $43,400 | $78,800 |
| 2014 | $1,818 | $122,200 | $43,400 | $78,800 |
| 2013 | $1,686 | $122,200 | $43,400 | $78,800 |
Source: Public Records
Map
Nearby Homes