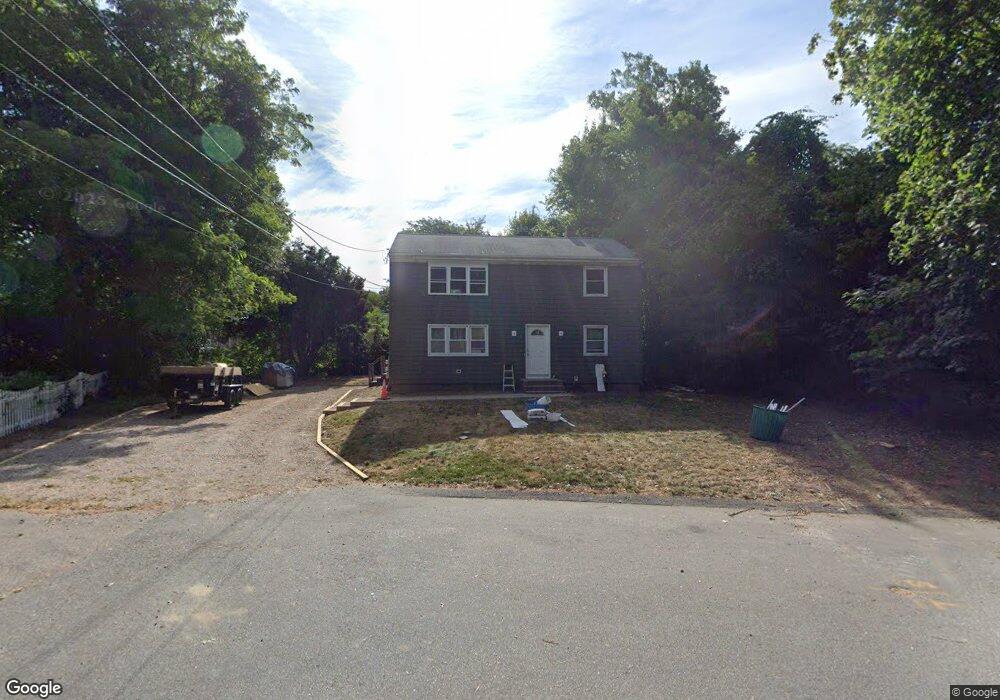
7 Laneway Ct Narragansett, RI 02882
Estimated Value: $832,000 - $948,000
2
Beds
2
Baths
1,120
Sq Ft
$792/Sq Ft
Est. Value
About This Home
This home is located at 7 Laneway Ct, Narragansett, RI 02882 and is currently estimated at $887,276, approximately $792 per square foot. 7 Laneway Ct is a home located in Washington County with nearby schools including Narragansett Elementary School, Narragansett Pier Middle School, and Narragansett High School.
Ownership History
Date
Name
Owned For
Owner Type
Purchase Details
Closed on
May 2, 2000
Sold by
Lavimodiere Michael P and Lavimodiere Erica B
Bought by
Ohara Patrick V and Beaudet Kristine A
Current Estimated Value
Home Financials for this Owner
Home Financials are based on the most recent Mortgage that was taken out on this home.
Original Mortgage
$88,000
Outstanding Balance
$30,148
Interest Rate
8.23%
Estimated Equity
$857,128
Create a Home Valuation Report for This Property
The Home Valuation Report is an in-depth analysis detailing your home's value as well as a comparison with similar homes in the area
Home Values in the Area
Average Home Value in this Area
Purchase History
| Date | Buyer | Sale Price | Title Company |
|---|---|---|---|
| Ohara Patrick V | $88,000 | -- |
Source: Public Records
Mortgage History
| Date | Status | Borrower | Loan Amount |
|---|---|---|---|
| Open | Ohara Patrick V | $88,000 |
Source: Public Records
Tax History
| Year | Tax Paid | Tax Assessment Tax Assessment Total Assessment is a certain percentage of the fair market value that is determined by local assessors to be the total taxable value of land and additions on the property. | Land | Improvement |
|---|---|---|---|---|
| 2025 | $4,760 | $701,100 | $394,800 | $306,300 |
| 2024 | $4,592 | $701,100 | $394,800 | $306,300 |
| 2023 | $4,466 | $479,700 | $263,200 | $216,500 |
| 2022 | $4,317 | $479,700 | $263,200 | $216,500 |
| 2021 | $4,250 | $479,700 | $263,200 | $216,500 |
| 2020 | $4,936 | $471,000 | $263,000 | $208,000 |
| 2019 | $4,818 | $471,000 | $263,000 | $208,000 |
| 2018 | $4,686 | $471,000 | $263,000 | $208,000 |
| 2017 | $4,003 | $379,100 | $246,500 | $132,600 |
| 2016 | $3,821 | $379,100 | $246,500 | $132,600 |
| 2015 | $3,768 | $379,100 | $246,500 | $132,600 |
| 2014 | $3,894 | $387,800 | $245,400 | $142,400 |
Source: Public Records
Map
Nearby Homes
- 54 Isabelle Dr
- 12 Park Ave Unit 13
- 416 Bridgetown Rd
- 106 Pettaquamscutt Lake Rd
- 125 Montauk Rd
- 36 Sachem Rd
- 1029 Boston Neck Rd Unit 2
- 51 Bonnet Shores Rd
- 53 Bonnet Shores Rd
- 15 Black Alder Trail
- 55 Bonnet Shores Rd
- 137 Bonnet Shores Rd
- 9 Parsley Ln
- 20 King Philip Rd
- 60 Brooklyn Rd
- 30 Maywood Rd
- 52 What Cheer Rd
- 8 Anchorage Rd
- 5 Wayland Trail
- 78 Conservatory Way Unit 78
Your Personal Tour Guide
Ask me questions while you tour the home.