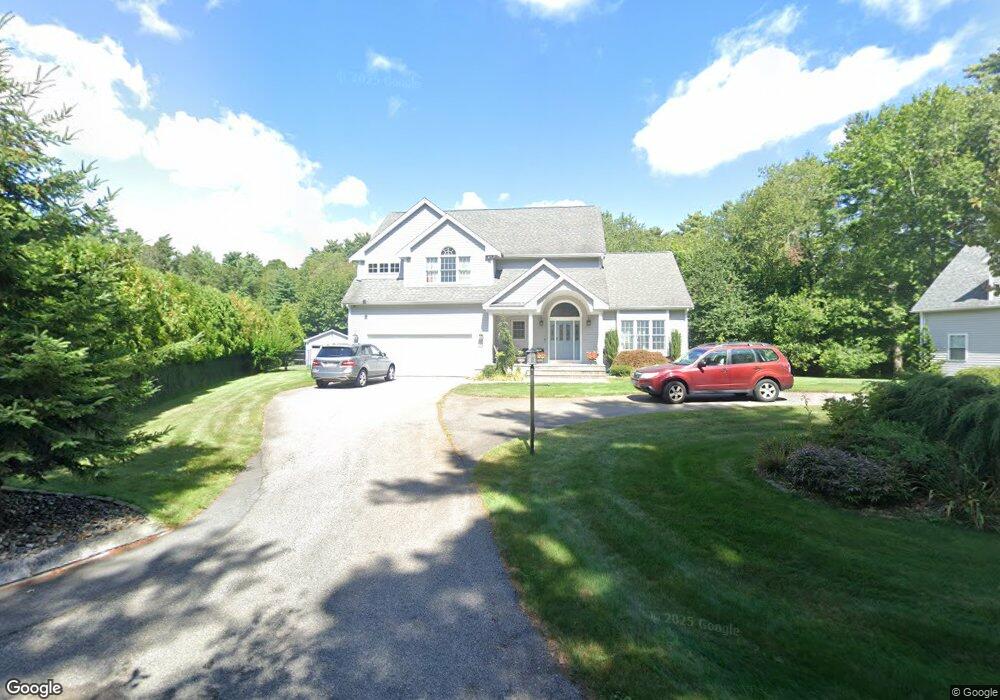
7 Lang Rd East Freetown, MA 02717
Estimated Value: $812,859 - $932,000
4
Beds
3
Baths
2,780
Sq Ft
$318/Sq Ft
Est. Value
About This Home
This home is located at 7 Lang Rd, East Freetown, MA 02717 and is currently estimated at $883,715, approximately $317 per square foot. 7 Lang Rd is a home with nearby schools including Freetown Elementary School, George R Austin Intermediate School, and Freetown-Lakeville Middle School.
Ownership History
Date
Name
Owned For
Owner Type
Purchase Details
Closed on
Mar 27, 2018
Sold by
Saraiva Lisa M
Bought by
Saraiva-Lima Lisa and Lima Jose L
Current Estimated Value
Purchase Details
Closed on
Sep 21, 2009
Sold by
Peacock Rt
Bought by
Saraiva Lisa M
Home Financials for this Owner
Home Financials are based on the most recent Mortgage that was taken out on this home.
Original Mortgage
$200,000
Interest Rate
5.28%
Mortgage Type
Purchase Money Mortgage
Create a Home Valuation Report for This Property
The Home Valuation Report is an in-depth analysis detailing your home's value as well as a comparison with similar homes in the area
Home Values in the Area
Average Home Value in this Area
Purchase History
| Date | Buyer | Sale Price | Title Company |
|---|---|---|---|
| Saraiva-Lima Lisa | -- | -- | |
| Saraiva Lisa M | $435,000 | -- |
Source: Public Records
Mortgage History
| Date | Status | Borrower | Loan Amount |
|---|---|---|---|
| Previous Owner | Saraiva Lisa M | $200,000 |
Source: Public Records
Tax History Compared to Growth
Tax History
| Year | Tax Paid | Tax Assessment Tax Assessment Total Assessment is a certain percentage of the fair market value that is determined by local assessors to be the total taxable value of land and additions on the property. | Land | Improvement |
|---|---|---|---|---|
| 2025 | $7,729 | $779,900 | $197,600 | $582,300 |
| 2024 | $7,744 | $742,500 | $186,300 | $556,200 |
| 2023 | $7,638 | $713,200 | $167,800 | $545,400 |
| 2022 | $7,370 | $611,100 | $142,200 | $468,900 |
| 2021 | $7,160 | $563,800 | $129,300 | $434,500 |
| 2020 | $7,208 | $553,600 | $124,300 | $429,300 |
| 2019 | $6,724 | $511,300 | $124,000 | $387,300 |
| 2018 | $6,518 | $489,700 | $124,000 | $365,700 |
| 2017 | $6,348 | $476,600 | $124,000 | $352,600 |
| 2016 | $6,108 | $466,600 | $120,400 | $346,200 |
| 2015 | $5,911 | $458,200 | $115,000 | $343,200 |
| 2014 | $5,739 | $455,100 | $118,000 | $337,100 |
Source: Public Records
Map
Nearby Homes
- 3 Abraham Ave
- 9 Paul Ave
- 28 Cedar Hill Dr
- 269 Middleboro Rd
- 247 Braley Hill Rd
- 4597 Acushnet Ave
- 0 Costa Dr
- 168 Keene Rd
- 319 Northwest St
- 120 Hackett Ave
- 60 Lakeside Ave
- 0 Keene Rd Unit 73459818
- 1069 Cherokee St
- 16 Swallow St
- 1475 Braley Rd Unit 17
- 13 Luscomb Ln
- 50 Blueberry Dr
- 64 Blaze Rd
- 199 Quaker Ln
- 34 Poplar Rd