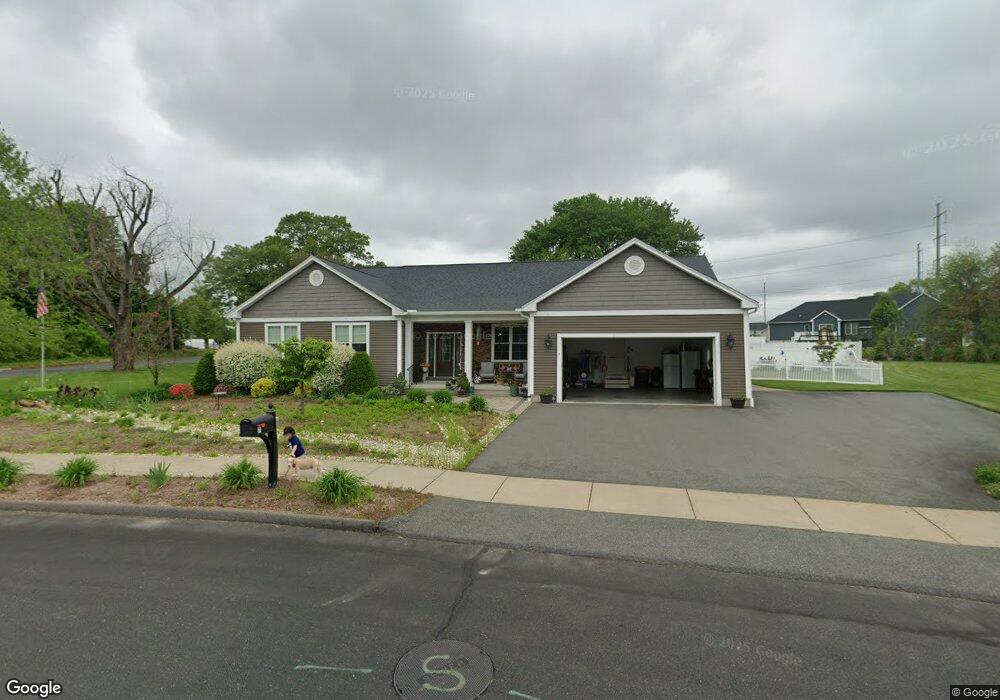
7 Lango Ln Agawam, MA 01001
Estimated Value: $715,000 - $936,000
3
Beds
2
Baths
2,000
Sq Ft
$411/Sq Ft
Est. Value
About This Home
This home is located at 7 Lango Ln, Agawam, MA 01001 and is currently estimated at $822,029, approximately $411 per square foot. 7 Lango Ln is a home located in Hampden County with nearby schools including Agawam Junior High School, Agawam High School, and St Thomas The Apostle School.
Ownership History
Date
Name
Owned For
Owner Type
Purchase Details
Closed on
Aug 22, 2024
Sold by
Messier T T and Messier M
Bought by
Messier Marc A and Hernandez Vanessa M
Current Estimated Value
Purchase Details
Closed on
Nov 16, 2021
Sold by
Harbey Jeffrey E and Harbey Kathy M
Bought by
Messier T T and Messier M
Home Financials for this Owner
Home Financials are based on the most recent Mortgage that was taken out on this home.
Original Mortgage
$250,000
Interest Rate
3.01%
Mortgage Type
Purchase Money Mortgage
Purchase Details
Closed on
Aug 14, 2015
Sold by
Cardaropoli Joseph
Bought by
Harbey Jeffrey E and Harbey Kathy M
Purchase Details
Closed on
May 31, 2013
Sold by
Pbi Inc
Bought by
Valentino Scott A and Valentino Ktistina M
Create a Home Valuation Report for This Property
The Home Valuation Report is an in-depth analysis detailing your home's value as well as a comparison with similar homes in the area
Home Values in the Area
Average Home Value in this Area
Purchase History
| Date | Buyer | Sale Price | Title Company |
|---|---|---|---|
| Messier Marc A | -- | None Available | |
| Messier Marc A | -- | None Available | |
| Messier T T | $689,000 | None Available | |
| Harbey Jeffrey E | $112,000 | -- | |
| Valentino Scott A | $115,000 | -- |
Source: Public Records
Mortgage History
| Date | Status | Borrower | Loan Amount |
|---|---|---|---|
| Previous Owner | Messier T T | $250,000 |
Source: Public Records
Tax History
| Year | Tax Paid | Tax Assessment Tax Assessment Total Assessment is a certain percentage of the fair market value that is determined by local assessors to be the total taxable value of land and additions on the property. | Land | Improvement |
|---|---|---|---|---|
| 2025 | $10,102 | $690,000 | $141,200 | $548,800 |
| 2024 | $9,845 | $677,100 | $141,200 | $535,900 |
| 2023 | $10,287 | $651,900 | $120,400 | $531,500 |
| 2022 | $8,574 | $532,200 | $120,400 | $411,800 |
| 2021 | $7,091 | $422,100 | $110,100 | $312,000 |
| 2020 | $6,971 | $414,200 | $108,500 | $305,700 |
| 2019 | $6,817 | $409,400 | $106,500 | $302,900 |
| 2018 | $6,445 | $388,000 | $102,500 | $285,500 |
| 2017 | $6,118 | $375,100 | $102,500 | $272,600 |
| 2016 | $1,658 | $102,500 | $102,500 | $0 |
| 2015 | $1,613 | $102,500 | $102,500 | $0 |
Source: Public Records
Map
Nearby Homes
Your Personal Tour Guide
Ask me questions while you tour the home.