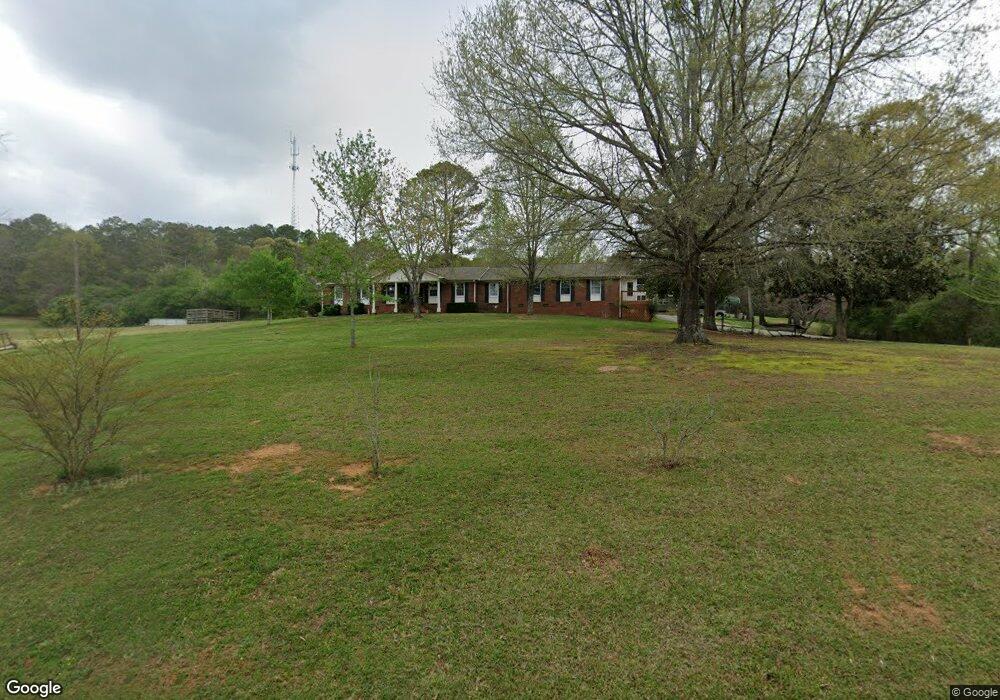
7 Laurel Ln SW Cave Spring, GA 30124
Estimated Value: $245,000 - $346,000
--
Bed
1
Bath
3,012
Sq Ft
$99/Sq Ft
Est. Value
About This Home
This home is located at 7 Laurel Ln SW, Cave Spring, GA 30124 and is currently estimated at $299,168, approximately $99 per square foot. 7 Laurel Ln SW is a home located in Floyd County with nearby schools including Coosa Middle School and Coosa High School.
Ownership History
Date
Name
Owned For
Owner Type
Purchase Details
Closed on
Jul 23, 2003
Sold by
Neal Maryann and Harrison Ii Carlysle Neal
Bought by
Neal Ii Harrison Carlysle
Current Estimated Value
Purchase Details
Closed on
Feb 14, 1994
Sold by
Neal Maryann
Bought by
Neal Maryann and Harrison Carlysle Ne
Purchase Details
Closed on
Dec 28, 1992
Sold by
Mary Ii Neal H and Mary Ann
Bought by
Neal Maryann
Purchase Details
Closed on
May 12, 1989
Sold by
Associates Financial Service
Bought by
Mary Ii Neal H and Mary Ann
Purchase Details
Closed on
Aug 2, 1988
Sold by
Wardlaw David R
Bought by
Associates Financial Service
Purchase Details
Closed on
Dec 11, 1978
Sold by
Nicholson Marjorie
Bought by
Wardlaw David R
Purchase Details
Closed on
Feb 1, 1977
Sold by
Cline Cline H and Cline Lindsey D
Bought by
Nicholson Marjorie
Purchase Details
Closed on
Jan 11, 1965
Bought by
Cline Cline H and Cline Lindsey D
Create a Home Valuation Report for This Property
The Home Valuation Report is an in-depth analysis detailing your home's value as well as a comparison with similar homes in the area
Home Values in the Area
Average Home Value in this Area
Purchase History
| Date | Buyer | Sale Price | Title Company |
|---|---|---|---|
| Neal Ii Harrison Carlysle | -- | -- | |
| Neal Maryann | -- | -- | |
| Neal Maryann | -- | -- | |
| Mary Ii Neal H | $49,500 | -- | |
| Associates Financial Service | $16,700 | -- | |
| Wardlaw David R | $44,900 | -- | |
| Nicholson Marjorie | $3,000 | -- | |
| Cline Cline H | -- | -- |
Source: Public Records
Tax History Compared to Growth
Tax History
| Year | Tax Paid | Tax Assessment Tax Assessment Total Assessment is a certain percentage of the fair market value that is determined by local assessors to be the total taxable value of land and additions on the property. | Land | Improvement |
|---|---|---|---|---|
| 2024 | $1,772 | $109,889 | $10,349 | $99,540 |
| 2023 | $1,649 | $102,750 | $9,408 | $93,342 |
| 2022 | $1,414 | $86,178 | $7,762 | $78,416 |
| 2021 | $1,277 | $77,582 | $7,065 | $70,517 |
| 2020 | $1,230 | $74,183 | $6,143 | $68,040 |
| 2019 | $1,193 | $73,506 | $6,143 | $67,363 |
| 2018 | $1,139 | $70,434 | $5,851 | $64,583 |
| 2017 | $1,067 | $66,423 | $5,418 | $61,005 |
| 2016 | $986 | $63,056 | $5,400 | $57,656 |
| 2015 | $938 | $63,056 | $5,400 | $57,656 |
| 2014 | $938 | $63,056 | $5,400 | $57,656 |
Source: Public Records
Map
Nearby Homes
- 10 Ridge Rd SW
- 8876 Cave Spring Rd SW
- 8876 Cave Spring
- 22 River St SW
- 104 Fincher St
- 57 Mill St
- 0 Mill Rd Unit 10629874
- 0 Mill Rd Unit 7670319
- 7 Herschel Mize Dr SW
- 7 Herschel Mize Dr
- 5677 Fosters Mill Rd SW
- 5598 Fosters Mill Rd
- 0 Melson Rd SW Unit 7676052
- 0 Melson Rd SW Unit 10636997
- 907 Gadsden Rd SW
- 424 Michael Blvd
- 123 Santa Claus Rd
- 100 Lee Ave
- 383 Valley Grove Rd
- 0 Booger Hollow Rd
- 5 Laurel Ln SW
- 0 Valley Rd SW Unit 10366863
- 2 Valley Rd SW
- 3 Laurel Ln SW
- 4 Laurel Ln SW
- 1 Valley Rd SW
- 9 Valley Rd SW
- 10 Valley Rd SW
- 10 Valley Rd SW
- 10 Valley Rd SW
- 14 Ridge Rd SW
- 0 Ridge Rd SW Unit 10366822
- 0 Ridge Rd SW Unit 10229709
- 23 Ridge Rd SW
- 27 Ridge Rd SW
- 15 Ridge Rd SW
- 8 Ridge Rd SW Unit 23
- 7 Ridge Rd SW
- 17 Ridge Rd SW
- 17 Ridge Rd SW